

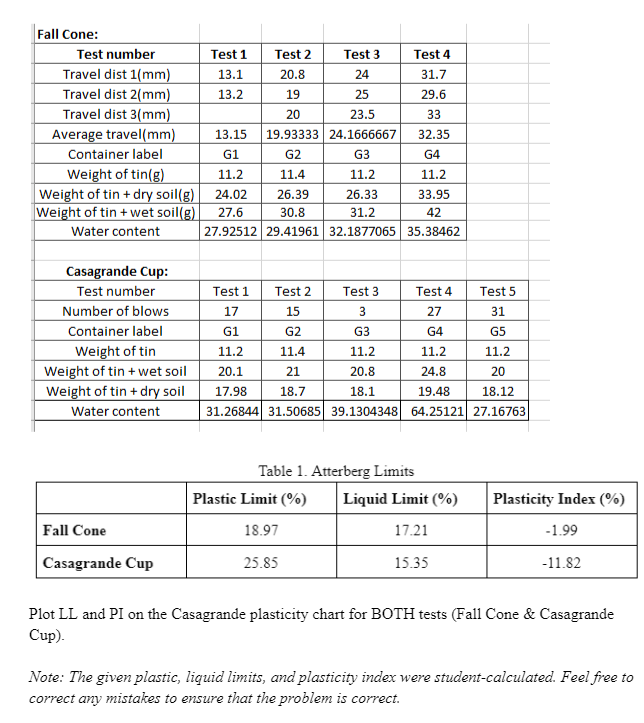
Question: Table 1 . Atterberg Limits Plot LL and PI on the Casagrande plasticity chart for BOTH tests ( Fall Cone & Casagrande Cup ) .
Table Atterberg Limits
Plot LL and PI on the Casagrande plasticity chart for BOTH tests Fall Cone & Casagrande
Cup
Note: The given plastic, liquid limits and plasticity index were studentcalculated. Feel free to
correct any mistakes to ensure that the problem is correct.
Step by Step Solution
There are 3 Steps involved in it
1 Expert Approved Answer
Step: 1 Unlock

Question Has Been Solved by an Expert!
Get step-by-step solutions from verified subject matter experts
Step: 2 Unlock
Step: 3 Unlock