

Question: Table 1 (below) presents article tone by time period. Review the table. and then answer the questions that follow. Table 1. Article Tone by Time
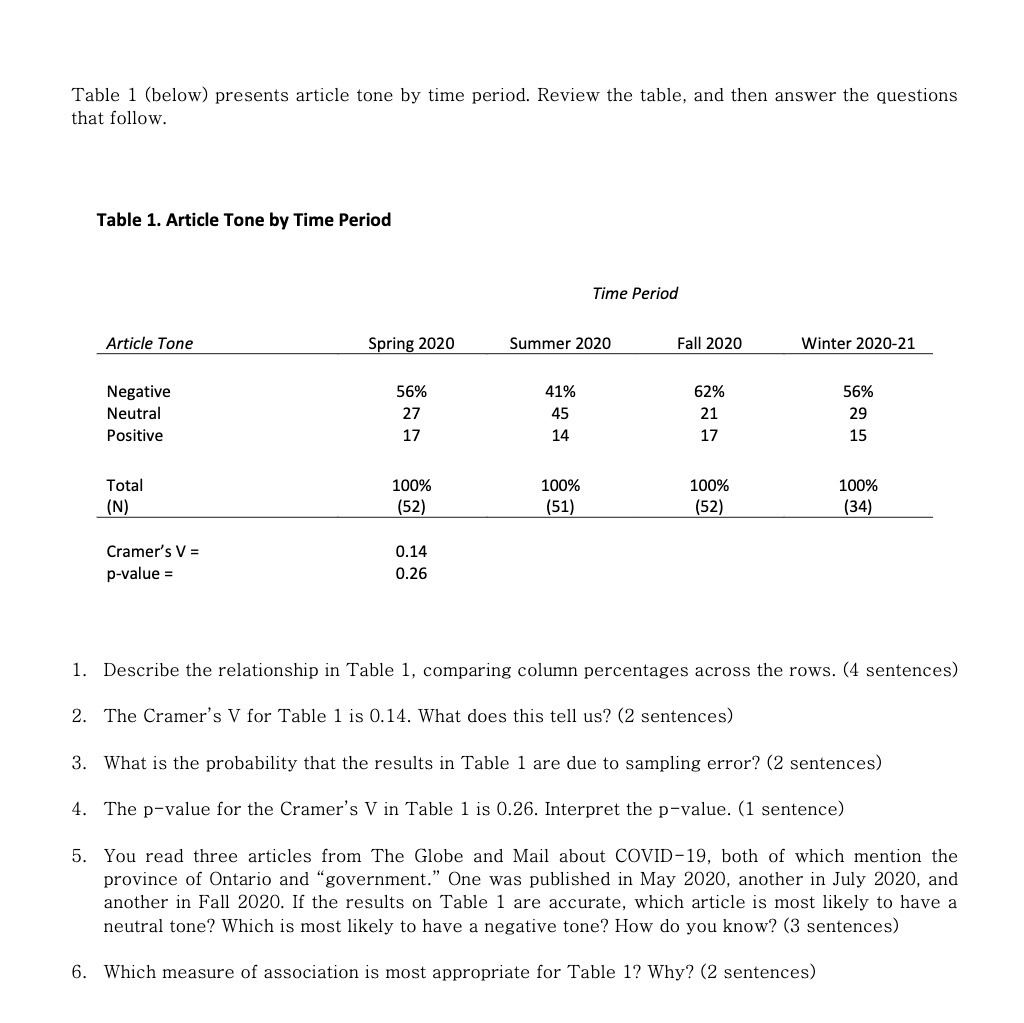
Table 1 (below) presents article tone by time period. Review the table. and then answer the questions that follow. Table 1. Article Tone by Time Period Time Period Article Tone Spring 2020 Summer 2020 Fall 20 20 Winter 202021 Negative 56% 41% 62% 56% Neutral 27 45 21 29 Positive 17 14 17 15 Total 100% 100% 100% 100% {N} {52) (51} (52} [34} Cramer's V = 0.14 p-value = 0.25 1. Describe the relationship in Table 1, comparing column percentages across the rows. (4 sentences} 2. The Cramer's V for Table 1 is 0.14. What does this tell us? (2 sentences) 3. What is the probability that the results in Table 1 are due to sampling error? (2 sentences) 4. The p-value for the Cramer's V in Tabie 1 is 0.26. Interpret the p-value. (1 sentence} 5. You read three articles from The Globe and Mail about COVID-IS, both of which mention the province of Ontario and \"government." One was published in May 2020, another in July 2020, and another in Fall 2020. If the results on Table 1 are accurate. which article is most likely to have a neutral tone? Which is most likely to have a negative tone? How do you know? (3 sentences) 6. Which measure of association is most appropriate for Table 1? Why? (2 sentences)
Step by Step Solution
There are 3 Steps involved in it

Get step-by-step solutions from verified subject matter experts