

Question: Table 2 (below) shows what we would expect the table showing article tone by time period to look like if these two variables were unrelated.
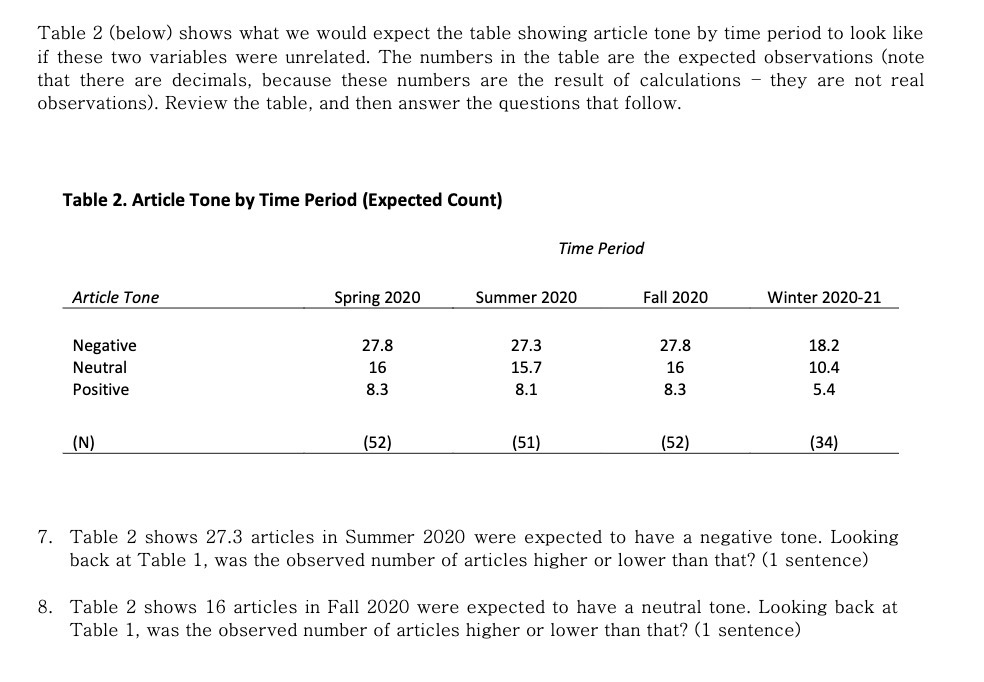
Table 2 (below) shows what we would expect the table showing article tone by time period to look like if these two variables were unrelated. The numbers in the table are the expected observations (note that there are decimals. because these numbers are the result of calculations they are not real observations). Review the table. and then answer the questions that follow. Table 2. Article Tone by Time Period (Expected Count] Time Period Article Tone Spring 2020 Summer 2020 Fall 2020 Negative 27.8 27.3 27.8 Neutral 16 15.7 16 Positive 8.3 8.1 8.3 {Ni {52) (51} (52} Winter 202021 18.2 10.4 5 . 4 [34} 7. Table 2 shows 27.3 articles in Summer 2020 were expected to have a negative tone. Looking back at Table 1, was the observed number of articles higher or lower than that? {1 sentence) 8. Table 2 shows 16 articles in Fall 2020 were expected to have a neutral tone. Looking back at Table 1. was the observed number of articles higher or lower than that? (1 sentence)
Step by Step Solution
There are 3 Steps involved in it

Get step-by-step solutions from verified subject matter experts