

Question: Table 1 displays the operation order and processing time ( in hours ) for individual jobs on respective machine centers. Propose three job scheduling algorithms
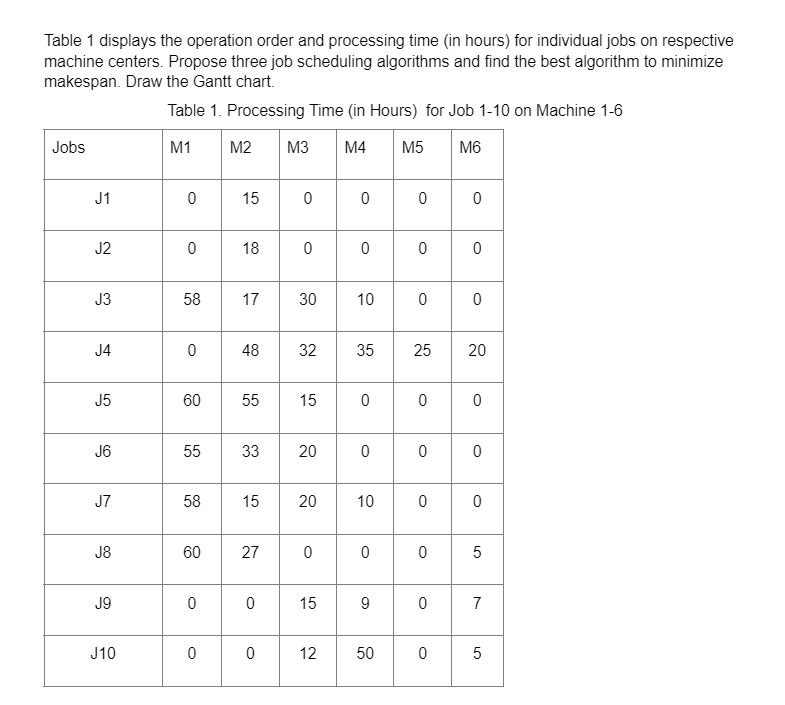
Table displays the operation order and processing time in hours for individual jobs on respective machine centers. Propose three job scheduling algorithms and find the best algorithm to minimize makespan. Draw the Gantt chart.
Table Processing Time in Hours for Job on Machine
tableJobsMMMMMMJJJJJJJJJ
Step by Step Solution
There are 3 Steps involved in it
1 Expert Approved Answer
Step: 1 Unlock

Question Has Been Solved by an Expert!
Get step-by-step solutions from verified subject matter experts
Step: 2 Unlock
Step: 3 Unlock