

Question: Table 1 . Excel spreadsheet simulation of a specific ( R , s , S ) policy for a given stream of daily demand The
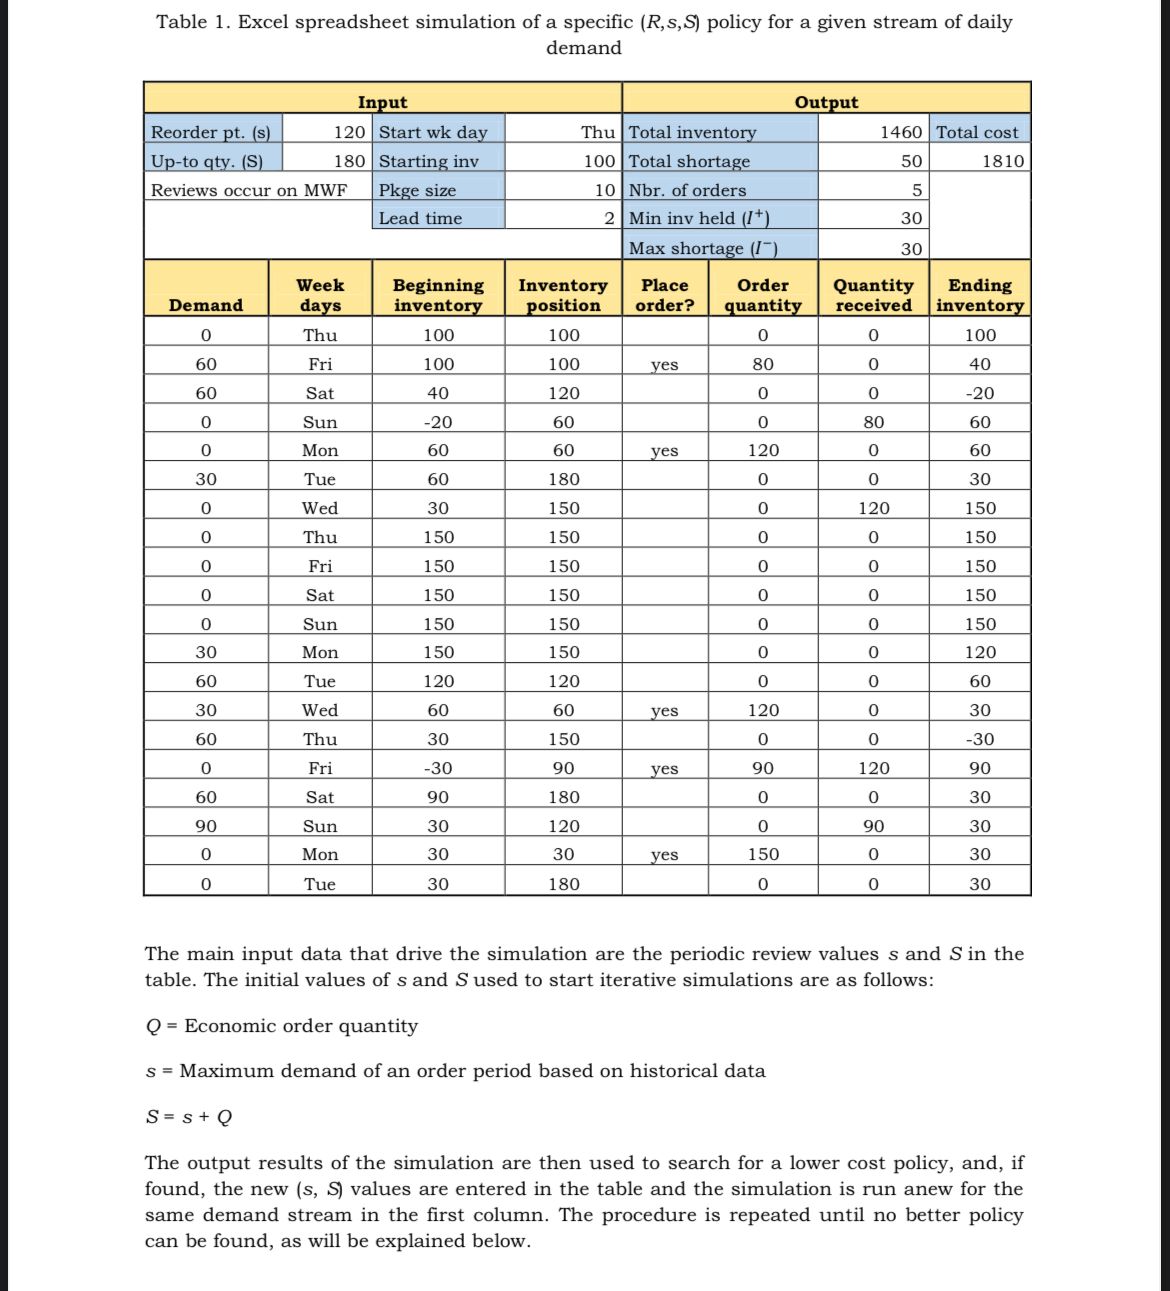
Table Excel spreadsheet simulation of a specific policy for a given stream of daily demand
The main input data that drive the simulation are the periodic review values and in the table. The initial values of and used to start iterative simulations are as follows:
Economic order quantity
Maximum demand of an order period based on historical data
The output results of the simulation are then used to search for a lower cost policy, and, if found, the new values are entered in the table and the simulation is run anew for the same demand stream in the first column. The procedure is repeated until no better policy can be found, as will be explained below.
Develop a spreadsheet simulation and apply the local search algorithm to find the s and S
values that Kroger should use in their inventory policy. Use the initial values given in Table
Submit an excel file including your calculations in every step of the algorithm.
Step by Step Solution
There are 3 Steps involved in it
1 Expert Approved Answer
Step: 1 Unlock

Question Has Been Solved by an Expert!
Get step-by-step solutions from verified subject matter experts
Step: 2 Unlock
Step: 3 Unlock