

Question: Table 1. Initial Rates as a Function of Initial Concentrations in the Formation of Hydraxine. I never had the chance to work op these data
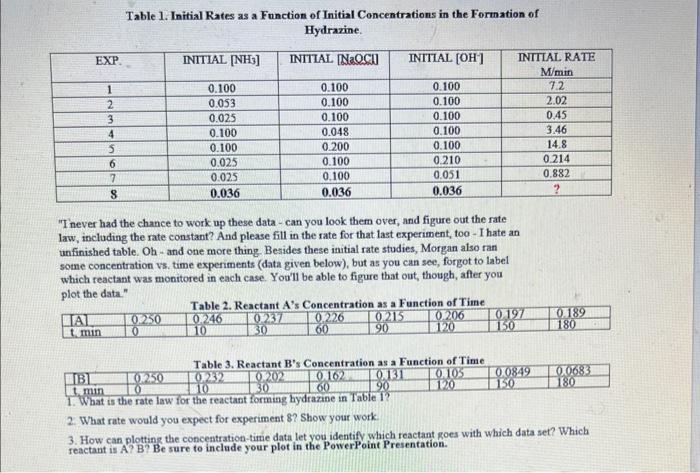
Table 1. Initial Rates as a Function of Initial Concentrations in the Formation of Hydraxine. "I never had the chance to work op these data - can you look them over, and figure out the rate law, including the rate constant? And please fill in the rate for that last experiment, too - I hate an unfinished table. Oh - and one more thing. Besides these initial rate studies, Morgan also ran sotme concentration vs. time experiments (data given below), but as you can see, forgot to label which reactant was monitored in each case. You'l be able to figure that out, though, after you plot the data." 2. What rate would you expect for experiment \$? Show yout work: 3. How can plotting the concentration-time data let you identify which reactant goes with which data set? Which reactant is A? B? Be sure to inclade your plot in the PowerPoint Presentation. Table 1. Initial Rates as a Function of Initial Concentrations in the Formation of Hydraxine. "I never had the chance to work op these data - can you look them over, and figure out the rate law, including the rate constant? And please fill in the rate for that last experiment, too - I hate an unfinished table. Oh - and one more thing. Besides these initial rate studies, Morgan also ran sotme concentration vs. time experiments (data given below), but as you can see, forgot to label which reactant was monitored in each case. You'l be able to figure that out, though, after you plot the data." 2. What rate would you expect for experiment \$? Show yout work: 3. How can plotting the concentration-time data let you identify which reactant goes with which data set? Which reactant is A? B? Be sure to inclade your plot in the PowerPoint Presentation
Step by Step Solution
There are 3 Steps involved in it

Get step-by-step solutions from verified subject matter experts