

Question: Table 1. Initial Rates as a Function of Initial Concentrations in the Formation of Hydraxinc. I never had the chance to uork up these data
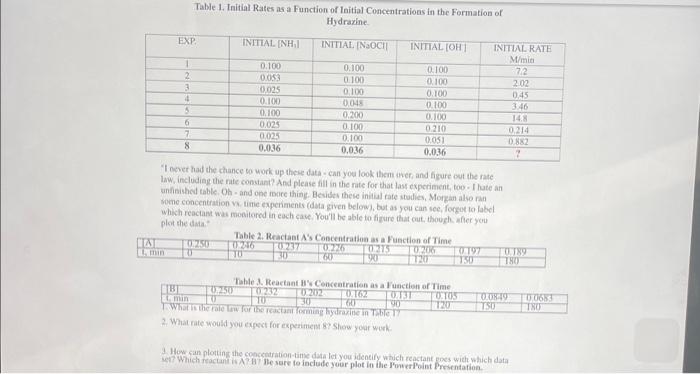
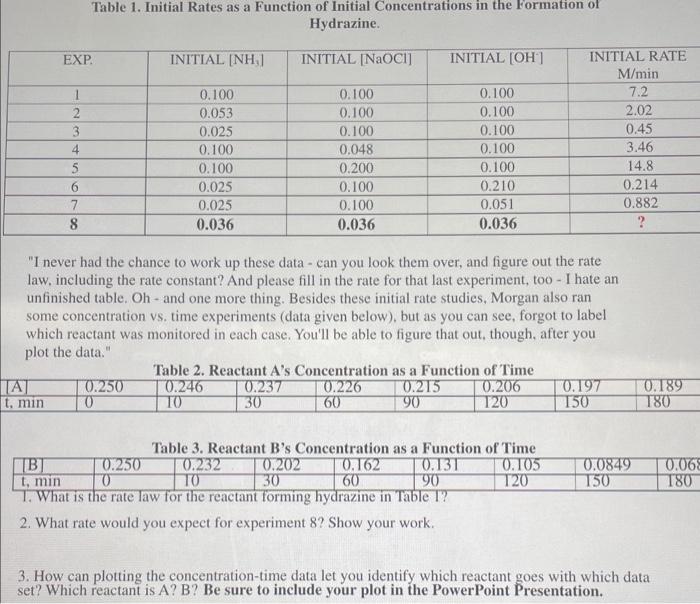
Table 1. Initial Rates as a Function of Initial Concentrations in the Formation of Hydraxinc. "I never had the chance to uork up these data - can you look them anen and figure out the rate law, includiag the rate consant? And please fill in the rate for that las experinent, too : I late an unainished table, Oh - and one roice thing. Bevites there initial rate stadies, Morgan also ran soene concentration vx. tinie experiments (daaa given below,, but as you can see, forgot io label which reactam was mooitored in eoch cave. You'll be able to figure that cut, thoogh wfier you plot the dasa." 4. what rate would you expect for experinien io shor yoar woek: 1. How can ploting the concentration-tine daat let you identify which reactant gnes wich which data Table 1. Initial Rates as a Function of Initial Concentrations in the Formation of Hydrazine. "I never had the chance to work up these data - can you look them over, and figure out the rate law, including the rate constant? And please fill in the rate for that last experiment, too - I hate an unfinished table. Oh - and one more thing. Besides these initial rate studies, Morgan also ran some concentration vs. time experiments (data given below), but as you can see, forgot to label which reactant was monitored in each case. You'll be able to figure that out, though, after you plot the data." Table 2. Reactant A's Concentration as a Function of Time Table 3. Reactant B's Concentration as a Function of Time 2. What rate would you expect for experiment 8 ? Show your work. 3. How can plotting the concentration-time data let you identify which reactant goes with which data set? Which reactant is A? B? Be sure to include your plot in the PowerPoint Presentation. Table 1. Initial Rates as a Function of Initial Concentrations in the Formation of Hydraxinc. "I never had the chance to uork up these data - can you look them anen and figure out the rate law, includiag the rate consant? And please fill in the rate for that las experinent, too : I late an unainished table, Oh - and one roice thing. Bevites there initial rate stadies, Morgan also ran soene concentration vx. tinie experiments (daaa given below,, but as you can see, forgot io label which reactam was mooitored in eoch cave. You'll be able to figure that cut, thoogh wfier you plot the dasa." 4. what rate would you expect for experinien io shor yoar woek: 1. How can ploting the concentration-tine daat let you identify which reactant gnes wich which data Table 1. Initial Rates as a Function of Initial Concentrations in the Formation of Hydrazine. "I never had the chance to work up these data - can you look them over, and figure out the rate law, including the rate constant? And please fill in the rate for that last experiment, too - I hate an unfinished table. Oh - and one more thing. Besides these initial rate studies, Morgan also ran some concentration vs. time experiments (data given below), but as you can see, forgot to label which reactant was monitored in each case. You'll be able to figure that out, though, after you plot the data." Table 2. Reactant A's Concentration as a Function of Time Table 3. Reactant B's Concentration as a Function of Time 2. What rate would you expect for experiment 8 ? Show your work. 3. How can plotting the concentration-time data let you identify which reactant goes with which data set? Which reactant is A? B? Be sure to include your plot in the PowerPoint Presentation
Step by Step Solution
There are 3 Steps involved in it

Get step-by-step solutions from verified subject matter experts