

Question: Table 1 is constructed to summarize the task descriptions, probabilistic time estimates, and precedence relationships. The completion target is 24 weeks for this project. However,
Table 1 is constructed to summarize the task descriptions, probabilistic time estimates, and precedence relationships.
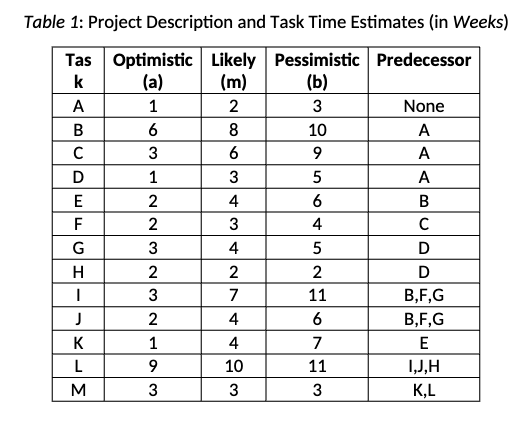
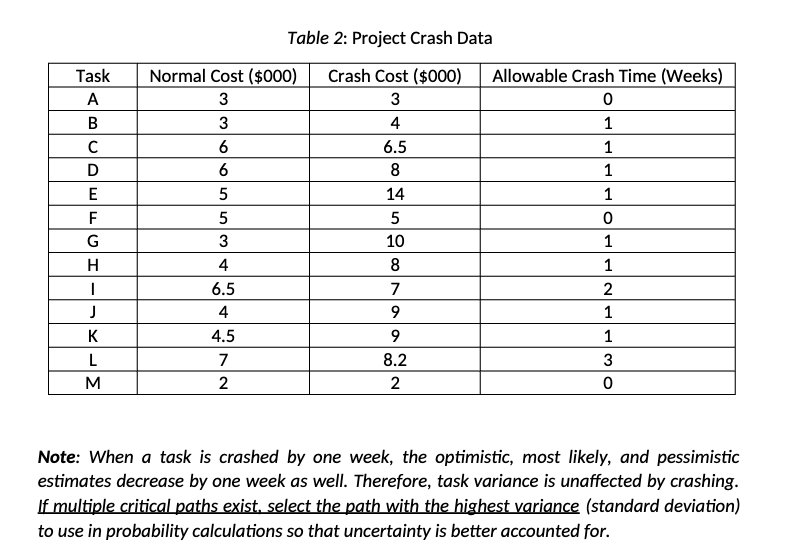
The completion target is 24 weeks for this project. However, a preliminary assessment indicates that some of the project tasks would need to be shortened to meet this desired project deadline. A set of task-crashing estimates has been prepared and is shown in Table 2.
Your boss has stressed that this is a very important project to manage and that you must do a thorough analysis to estimate the projects completion time and budget before presenting your findings/recommendations in a business report.
1) Calculate each activitys expected time and variance for the Normal scenario. a. Draw the network diagram and determine the critical path. b. What is the estimated completion time for this project? c. What is the estimated project cost? d. What is the probability that the project will be completed in 28 weeks with this project plan? e. What is the probability that the project will be completed in 24 weeks with this project plan?
2) Crash the project until you reach the Maximum Crashing scenario and detail your steps (hint: does not necessarily mean that every activity must be crashed to its maximum allowable crash time). a. What is the minimum expected time in which this project can be completed and at what cost? b. What is the probability of completing the project in 24 weeks with this project plan?
3) Suppose that the cost of being late to the market is estimated to be $10,000 per week if the project completion time exceeds 24 weeks. Develop a graph to depict the total cost function of crashing the project. a. Graph should show the direct (normal + any crashing), indirect (late penalties), and total costs for each week in the range between the Normal project duration to the Maximum Crashing duration.
Table 1: Proiect Description and Task Time Estimates (in Weeks) Table 2: Project Crash Data Note: When a task is crashed by one week, the optimistic, most likely, and pessimistic estimates decrease by one week as well. Therefore, task variance is unaffected by crashing. If multiple critical paths exist. select the path with the highest variance (standard deviation) to use in probability calculations so that uncertainty is better accounted for
Step by Step Solution
There are 3 Steps involved in it

Get step-by-step solutions from verified subject matter experts