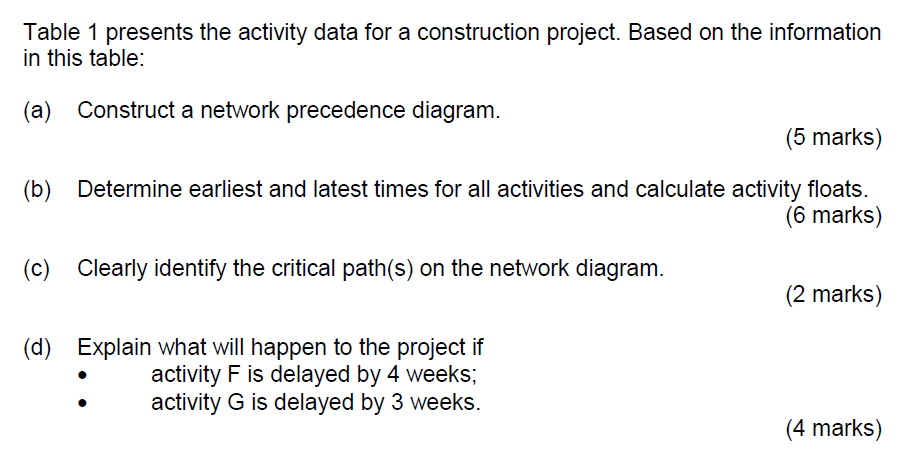
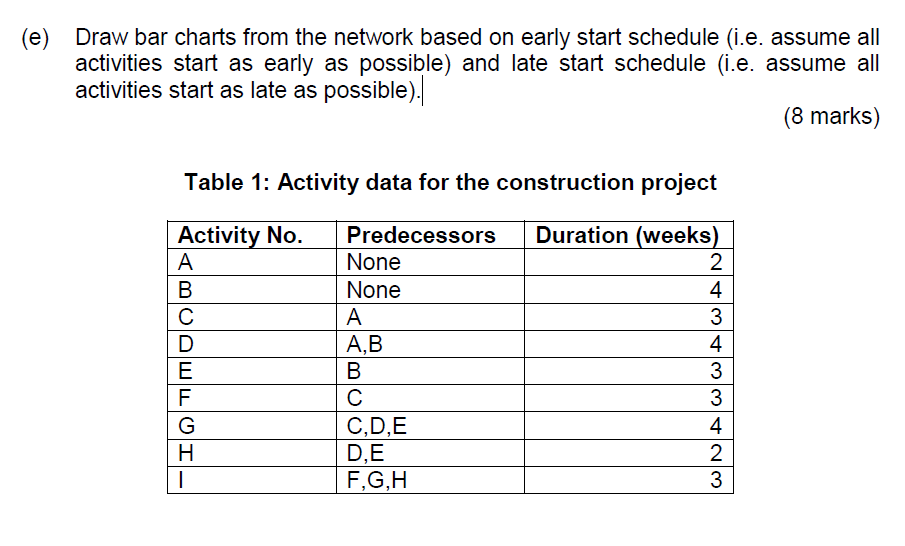
Question: Table 1 presents the activity data for a construction project. Based on the information in this table: (a) Construct a network precedence diagram. (5 marks)

Table 1 presents the activity data for aTable 1 presents the activity data for a

Table 1 presents the activity data for a construction project. Based on the information in this table: (a) Construct a network precedence diagram. (5 marks) (b) Determine earliest and latest times for all activities and calculate activity floats. (6 marks) (c) Clearly identify the critical path(s) on the network diagram. (2 marks) (d) Explain what will happen to the project if activity F is delayed by 4 weeks; activity G is delayed by 3 weeks. (4 marks) (e) Draw bar charts from the network based on early start schedule (i.e. assume all activities start as early as possible) and late start schedule (i.e. assume all activities start as late as possible). (8 marks) Table 1: Activity data for the construction project Activity No. A B D E F |||IG Predecessors None None A A,B B C C,D,E D,E F,G,H Duration (weeks) 2 4 3 4 3 3 4 2 3 NTVN H

Step by Step Solution

There are 3 Steps involved in it

1 Expert Approved Answer
Step: 1 Unlock blur-text-image
Question Has Been Solved by an Expert!

Get step-by-step solutions from verified subject matter experts

Step: 2 Unlock
Step: 3 Unlock

Students Have Also Explored These Related General Management Questions!