

Question: Table 1 shows 25 consecutive thickness observations measured in a product. The manufacturing company producing the parts has to determine whether the thickness (cm) of
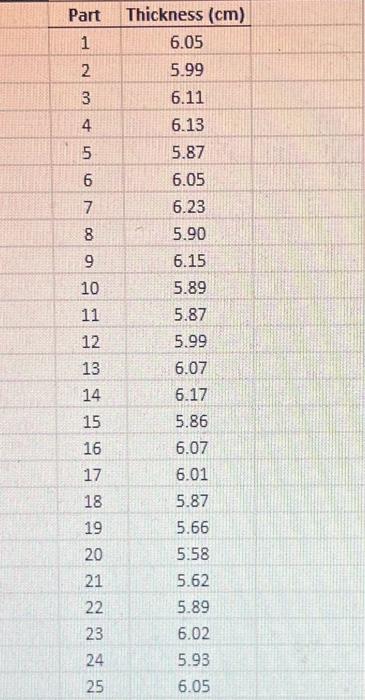
Table 1 shows 25 consecutive thickness observations measured in a product. The manufacturing company producing the parts has to determine whether the thickness (cm) of the parts fall within normal and acceptable limits. a. Use the data in Table 1 to set up a controt chart for individuat observations and a moving range chart, Does the process exhiart statistkal controlf Explain your answer. (5 pts.) b. Fstimate the mean and standard deviation of the thickness. (4 pts.) c. The ll wants to construct a cause-and effect diagram for possible causes for the thickness of some parts fauling to pass the inspection. Present and explain one possible cause for each one of the 6Ms (DO NOr need to plot the diagram) (6 pts.) \begin{tabular}{|c|c} \hline Part & Thickness (cm) \\ \hline 1 & 6.05 \\ \hline 2 & 5.99 \\ 3 & 6.11 \\ \hline 4 & 6.13 \\ \hline 5 & 5.87 \\ \hline 6 & 6.05 \\ \hline 7 & 6.23 \\ \hline 8 & 5.90 \\ 9 & 6.15 \\ \hline 10 & 5.89 \\ 11 & 5.87 \\ \hline 12 & 5.99 \\ 13 & 6.07 \\ 14 & 6.17 \\ 15 & 5.86 \\ \hline 16 & 6.07 \\ 17 & 6.01 \\ 18 & 5.87 \\ 19 & 5.66 \\ \hline 20 & 5.58 \\ 21 & 5.62 \\ \hline 22 & 5.89 \\ \hline 23 & 6.02 \\ \hline 24 & 5.93 \\ 25 & 6.05 \\ \hline \end{tabular} Table 1 shows 25 consecutive thickness observations measured in a product. The manufacturing company producing the parts has to determine whether the thickness (cm) of the parts fall within normal and acceptable limits. a. Use the data in Table 1 to set up a controt chart for individuat observations and a moving range chart, Does the process exhiart statistkal controlf Explain your answer. (5 pts.) b. Fstimate the mean and standard deviation of the thickness. (4 pts.) c. The ll wants to construct a cause-and effect diagram for possible causes for the thickness of some parts fauling to pass the inspection. Present and explain one possible cause for each one of the 6Ms (DO NOr need to plot the diagram) (6 pts.) \begin{tabular}{|c|c} \hline Part & Thickness (cm) \\ \hline 1 & 6.05 \\ \hline 2 & 5.99 \\ 3 & 6.11 \\ \hline 4 & 6.13 \\ \hline 5 & 5.87 \\ \hline 6 & 6.05 \\ \hline 7 & 6.23 \\ \hline 8 & 5.90 \\ 9 & 6.15 \\ \hline 10 & 5.89 \\ 11 & 5.87 \\ \hline 12 & 5.99 \\ 13 & 6.07 \\ 14 & 6.17 \\ 15 & 5.86 \\ \hline 16 & 6.07 \\ 17 & 6.01 \\ 18 & 5.87 \\ 19 & 5.66 \\ \hline 20 & 5.58 \\ 21 & 5.62 \\ \hline 22 & 5.89 \\ \hline 23 & 6.02 \\ \hline 24 & 5.93 \\ 25 & 6.05 \\ \hline \end{tabular}
Step by Step Solution
There are 3 Steps involved in it

Get step-by-step solutions from verified subject matter experts