

Question: Table 1 shows Chi-square test results between each independent variable and each dependent variable. Answer the following questions based on the table provided below. Q1)
Table 1 shows Chi-square test results between each independent variable and each dependent variable.
Answer the following questions based on the table provided below.
Q1) How many Chi-square tests are in Table?
Q2) How many group differences in the prevalence of current cigarette smoking or the prevalence of depression are statistically significant in Table?
* Hint for Q13)-Q14): Check p-value.
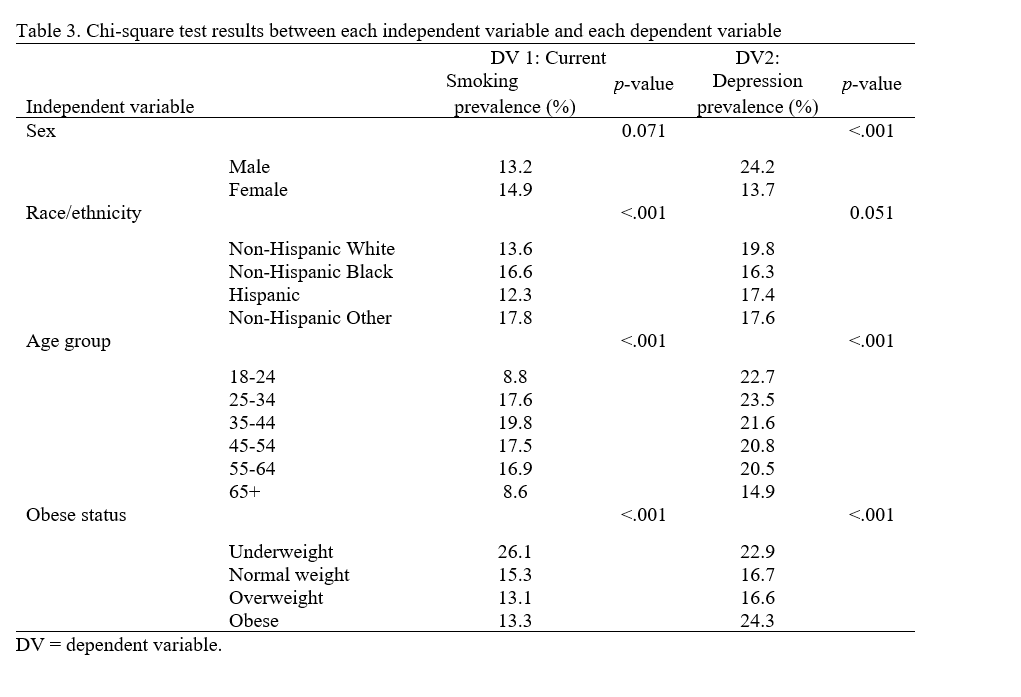
Table 3. Chi-square test results between each independent variable and each dependent variable DV 1: Current DV2: Smoking p-value Depression Independent variable p-value prevalence (%) prevalence (%) Sex 0.071 <.001 male female race non-hispanic white black hispanic other age group obese status underweight normal weight overweight dv="dependent" variable>
Step by Step Solution
There are 3 Steps involved in it

Get step-by-step solutions from verified subject matter experts