

Question: Table 1 shows the budgeted costs for a 10-week project. Table 2 shows the actual costs through week 6. Table 3 shows the cumulative percentage
Table 1 shows the budgeted costs for a 10-week project. Table 2 shows the actual costs through week 6. Table 3 shows the cumulative percentage of work completed through week 6.
Create graphs of the cumulative budgeted costs (CBC), cumulative actual costs (CAC), and cumulative earned value (CEV) as a function of time.
Create a plot of the Cost Performance Index (CPI) as a function of time through week 6.
Create a plot of the Cost Variance (CV) as a function of time through week 6.
Using Method 1 and Method 2, make a plot of the forecasted final costs as a function of time through week 6.
What is the financial health of the project at the end of week 6? Explain what is causing the cost overrun or underrun (if there is one).
From the information you have, can you comment on whether the project is ahead or behind schedule?
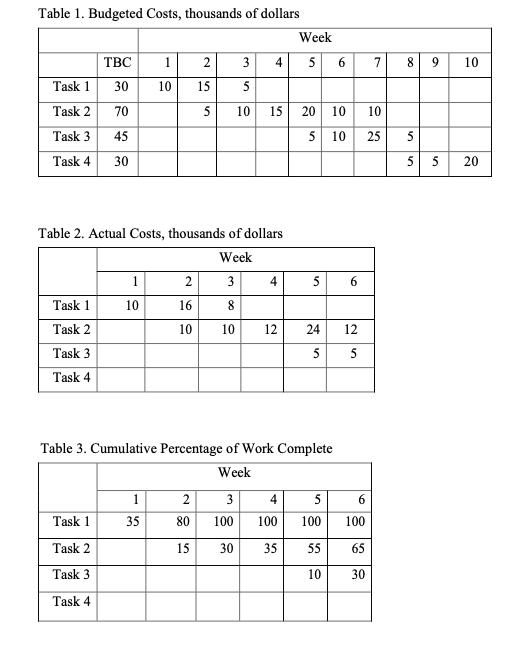
Table 1. Budgeted Costs, thousands of dollars Week TBC 1 2 4 5 7 9. 10 Task 1 30 10 15 Task 2 70 10 15 20 10 10 Task 3 45 5 10 25 5 Task 4 30 5 5 20 Table 2. Actual Costs, thousands of dollars Week 1 2 3 4 5 6. Task 1 10 16 Task 2 10 10 12 24 12 Task 3 5 5 Task 4 Table 3. Cumulative Percentage of Work Complete Week 1 2 3 4 5 6. Task 1 35 80 100 100 100 100 Task 2 15 30 35 65 Task 3 10 30 Task 4 6. 3.
Step by Step Solution
3.30 Rating (144 Votes )
There are 3 Steps involved in it
a Cumulative budgeted cost at end of week 6 Week 1 2 3 4 5 6 Task A 10 15 5 Task B 10 10 10 20 10 Task C 5 5 Task D Weekly budgeted costs 10 25 15 10 ... View full answer

Get step-by-step solutions from verified subject matter experts