

Question: TABLE 1: SOFT DRIN DEMAND DATA Region Provinces Cans/Capita/Year 6-Pack Price ($) Income/Capita ($1,000) Mean Temp. (F) CAR Abra 200 2.19 11.7 66 Apayao 150
TABLE 1: SOFT DRIN DEMAND DATA Region Provinces Cans/Capita/Year 6-Pack Price ($) Income/Capita ($1,000) Mean Temp. (F) CAR Abra 200 2.19 11.7 66 Apayao 150 1.99 15.3 62 Benguet 237 1.93 9.9 63 Mountain Province 135 2.59 22.5 56 Region 1 Ilocos Norte 121 2.29 17.1 52 Ilocos Sur 118 2.49 24.3 50 La Union 217 1.99 25.2 52 Pangasinan 242 2.29 16.2 72 Regionn 2 Batanes 295 1.89 12.6 64 Cagayan 85 2.39 14.4 46 Isabela 114 2.35 21.6 52 Nueva Vizcaya 184 2.19 18 52 Quirino 104 2.21 14.4 50 Region 3 Bataan 143 2.17 15.3 56 Bulacan 230 2.05 11.7 56 Nueva Ecija 269 1.97 13.5 69 Pampanga 111 2.19 14.4 41 Tarlac 217 2.11 18.9 54 Region 4A Batangas 114 2.29 19.8 47 Cavite 108 2.25 18.9 47 Laguna 108 2.31 16.2 41 Quezon 248 1.98 9 65 Rizal 203 1.94 17.1 57 Region 4B Marinduque 77 2.31 17.1 44 Occidental Mindoro 97 2.28 14.4 49 Oriental Mindoro 166 2.19 21.6 48 Palawan 177 2.27 16.2 35 Romblon 143 2.31 21.6 54 Region 5 Albay 157 2.17 13.5 56 Camarines Norte 111 2.43 22.5 48 Catanduanes 330 1.89 11.7 59 Masbate 63 2.33 12.6 39 Sorsogon 165 2.21 19.8 51 Region 6 Aklan 184 2.19 14.4 82 Antique 68 2.25 17.1 51 Capiz 121 2.31 18 50 Guimaras 138 2.23 18 50 Iloilo 237 1.93 10.8 65 Negros Occidental 95 2.34 11.7 45 Region 7 Bohol 236 2.19 11.7 60 Cebu 222 2.08 15.3 69 Negros Oriental 100 2.37 14.4 50 Siquijor 64 2.36 14.4 44 Region 8 Biliran 270 2.04 14.4 58 Eastern Samar 77 2.19 18 49 Northern Samar 144 2.11 13.5 55 Samar 97 2.38 17.1 46 Southern Leyte 102 2.31 17.1 46 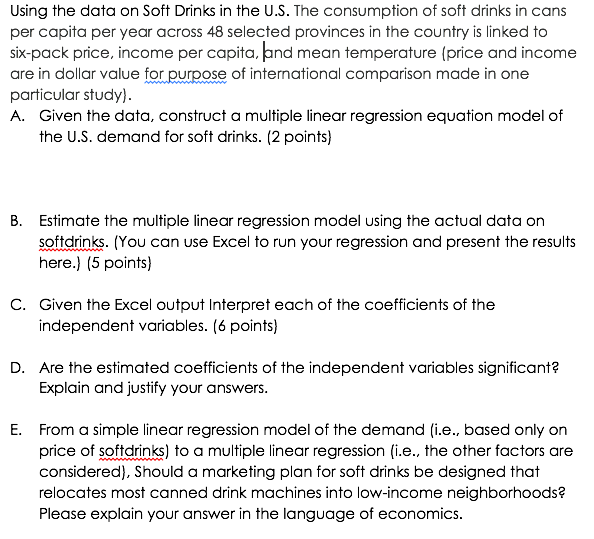
Using the data on Soft Drinks in the U.S. The consumption of soft drinks in cans per capita per year across 48 selected provinces in the country is linked to six-pack price, income per capita, and mean temperature (price and income are in dollar value for purpose of international comparison made in one particular study). A. Given the data, construct a multiple linear regression equation model of the U.S. demand for soft drinks. (2 points) B. Estimate the multiple linear regression model using the actual data on softdrinks. (You can use Excel to run your regression and present the results here.) (5 points) C. Given the Excel output Interpret each of the coefficients of the independent variables. (6 points) D. Are the estimated coefficients of the independent variables significant? Explain and justify your answers. E. From a simple linear regression model of the demand (i.e., based only on price of softdrinks) to a multiple linear regression (i.e., the other factors are considered), Should a marketing plan for soft drinks be designed that relocates most canned drink machines into low-income neighborhoods? Please explain your answer in the language of economics
Step by Step Solution
There are 3 Steps involved in it

Get step-by-step solutions from verified subject matter experts