

Question: Table 1 Table 2 The images below show different graphs. One of them corresponds to the values in Table 1 above. Another corresponds to the
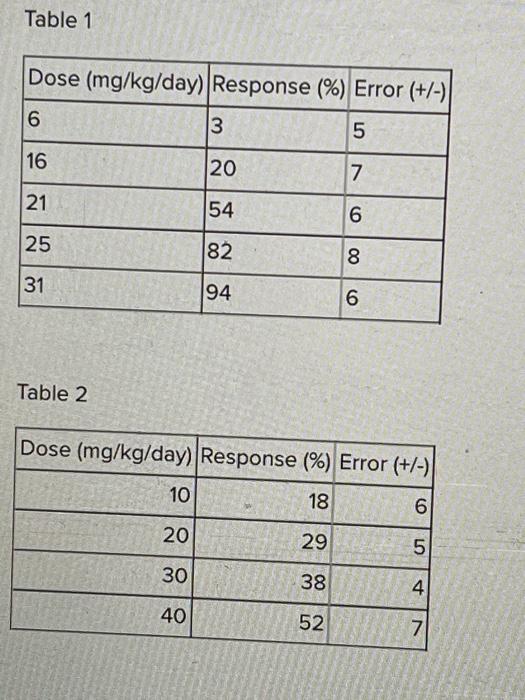
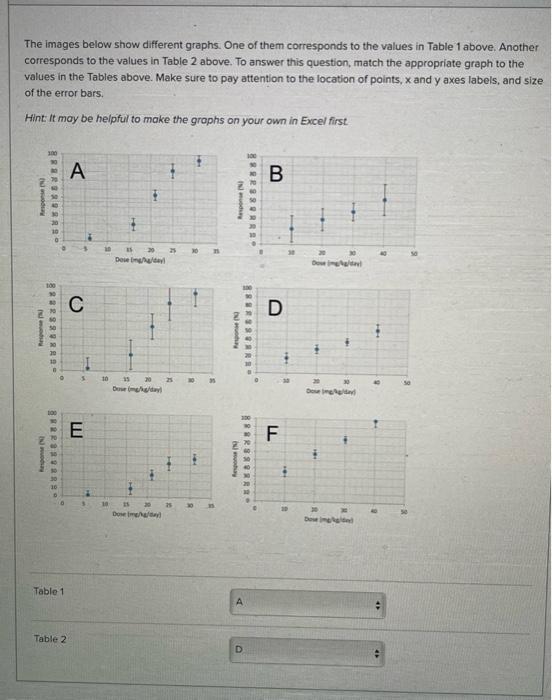
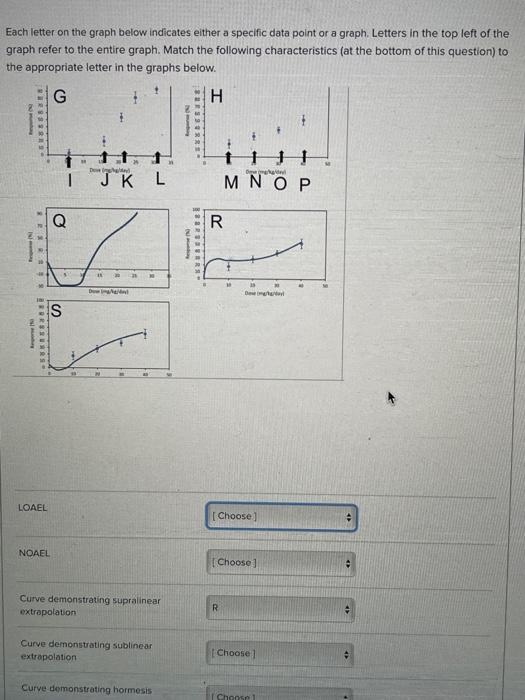
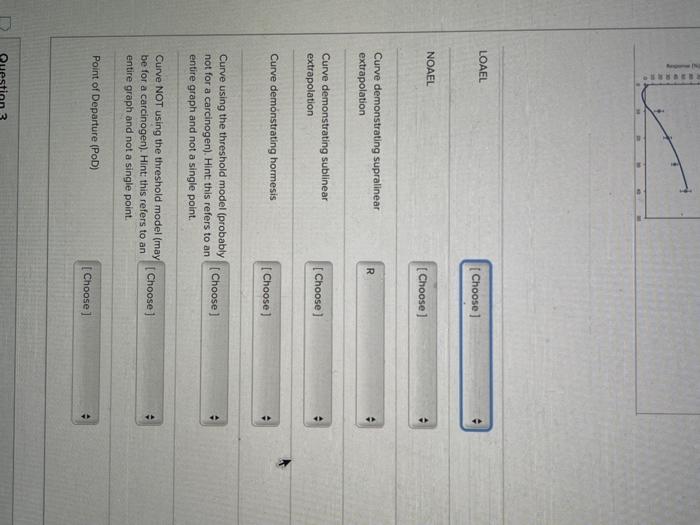
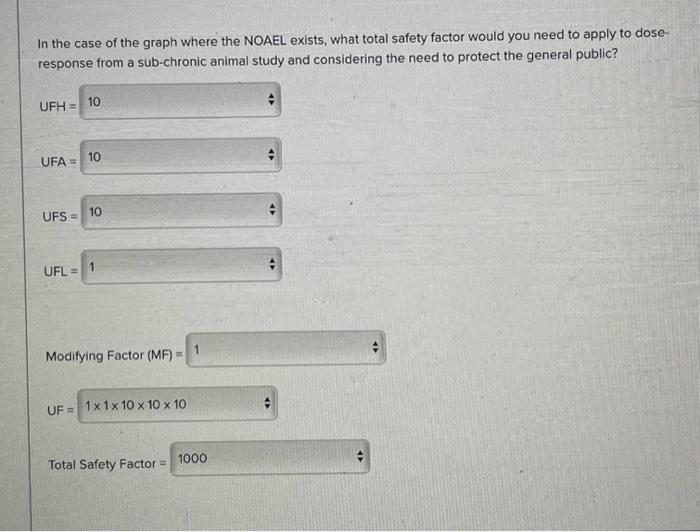
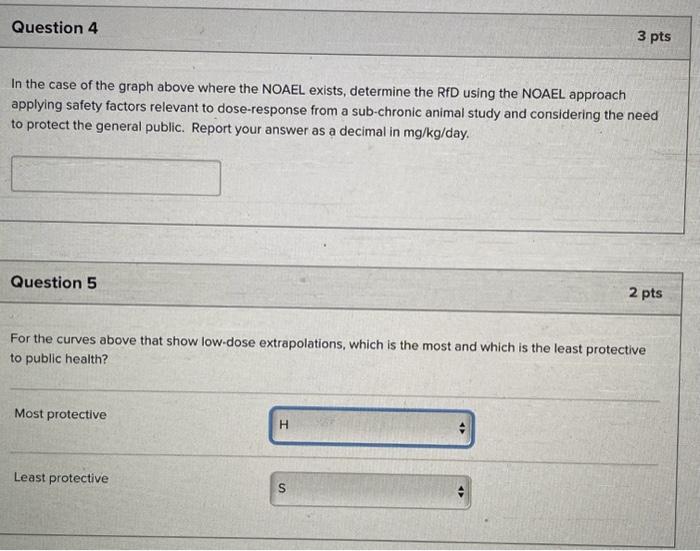
Table 1 Table 2 The images below show different graphs. One of them corresponds to the values in Table 1 above. Another corresponds to the values in Table 2 above. To answer this question, match the appropriate graph to the values in the Tables above. Make sure to pay attention to the location of points, x and y axes labels, and size of the error bars. Hint: It may be helpful to make the grophs on your own in Excel first. Table 1 Table 2 Each letter on the graph below indicates either a specific data point or a graph. Letters in the top left of the graph refer to the entire graph. Match the following characteristics (at the bottom of this question) to the appropriate letter in the graphs below. LOAEL NOAEL Curve demonstrating supralinear extrapolation Curve demonstrating sublinear extrapolation Curve demonstrating hormesis NOAEL Curve demonstrating supralinear extrapolation Curve demonstrating sublinear extrapolation Curve demonstrating hormesis Curve using the threshold model (probably not for a carcinogen). Hint: this refers to an entire graph and not a single point. Curve NOT using the threshold model imay be for a carcinogen). Hint: this refers to an entire graph and not a single point. Point of Departure (PoD) In the case of the graph where the NOAEL exists, what total safety factor would you need to apply to doseresponse from a sub-chronic animal study and considering the need to protect the general public? UFH= UFA = UFS = UFL= Modifying Factor (MF)= UF = Total Safety Factor = In the case of the graph above where the NOAEL exists, determine the RfD using the NOAEL approach applying safety factors relevant to dose-response from a sub-chronic animal study and considering the need to protect the general public. Report your answer as a decimal in mg/kg/ day. Question 5 2 pts For the curves above that show low-dose extrapolations, which is the most and which is the least protective to public health? Most protective Least protective Table 1 Table 2 The images below show different graphs. One of them corresponds to the values in Table 1 above. Another corresponds to the values in Table 2 above. To answer this question, match the appropriate graph to the values in the Tables above. Make sure to pay attention to the location of points, x and y axes labels, and size of the error bars. Hint: It may be helpful to make the grophs on your own in Excel first. Table 1 Table 2 Each letter on the graph below indicates either a specific data point or a graph. Letters in the top left of the graph refer to the entire graph. Match the following characteristics (at the bottom of this question) to the appropriate letter in the graphs below. LOAEL NOAEL Curve demonstrating supralinear extrapolation Curve demonstrating sublinear extrapolation Curve demonstrating hormesis NOAEL Curve demonstrating supralinear extrapolation Curve demonstrating sublinear extrapolation Curve demonstrating hormesis Curve using the threshold model (probably not for a carcinogen). Hint: this refers to an entire graph and not a single point. Curve NOT using the threshold model imay be for a carcinogen). Hint: this refers to an entire graph and not a single point. Point of Departure (PoD) In the case of the graph where the NOAEL exists, what total safety factor would you need to apply to doseresponse from a sub-chronic animal study and considering the need to protect the general public? UFH= UFA = UFS = UFL= Modifying Factor (MF)= UF = Total Safety Factor = In the case of the graph above where the NOAEL exists, determine the RfD using the NOAEL approach applying safety factors relevant to dose-response from a sub-chronic animal study and considering the need to protect the general public. Report your answer as a decimal in mg/kg/ day. Question 5 2 pts For the curves above that show low-dose extrapolations, which is the most and which is the least protective to public health? Most protective Least protective
Step by Step Solution
There are 3 Steps involved in it

Get step-by-step solutions from verified subject matter experts