

Question: Table 1, which an exam of statistics: Points Frequency summarizes the scores of 170 students in [0,40) [40,50) [50,60) [60, 70) [70,80) [80,90) [90,
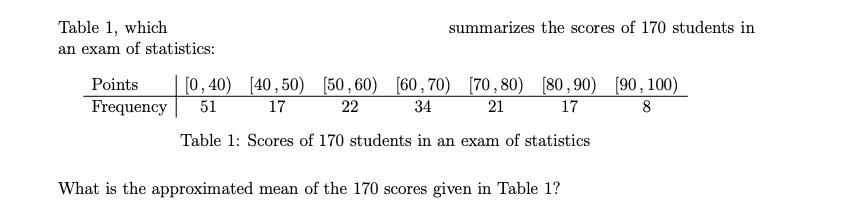
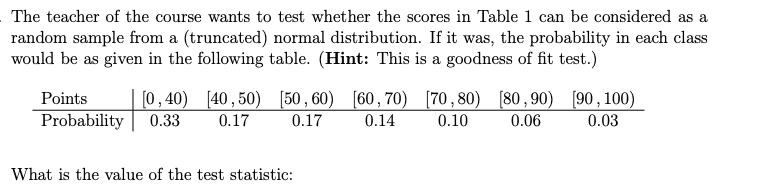
Table 1, which an exam of statistics: Points Frequency summarizes the scores of 170 students in [0,40) [40,50) [50,60) [60, 70) [70,80) [80,90) [90, 100) 51 17 22 34 21 17 8 Table 1: Scores of 170 students in an exam of statistics What is the approximated mean of the 170 scores given in Table 1? The teacher of the course wants to test whether the scores in Table 1 can be considered as a random sample from a (truncated) normal distribution. If it was, the probability in each class would be as given in the following table. (Hint: This is a goodness of fit test.) Points [0,40) Probability 0.33 [40,50) [50,60) [60, 70) [70,80) [80,90) [90, 100) 0.17 0.14 0.10 0.03 0.17 0.06 What is the value of the test statistic:
Step by Step Solution
There are 3 Steps involved in it

Get step-by-step solutions from verified subject matter experts