

Question: TABLE 11.4 VALUES OF Po FOR MULTIPLE-SERVER WAITING LINES WITH POISSON ARRIVALS AND EXPONENTIAL SERVICE TIMES Number of Servers (k) 2 3 4 5 Ratio
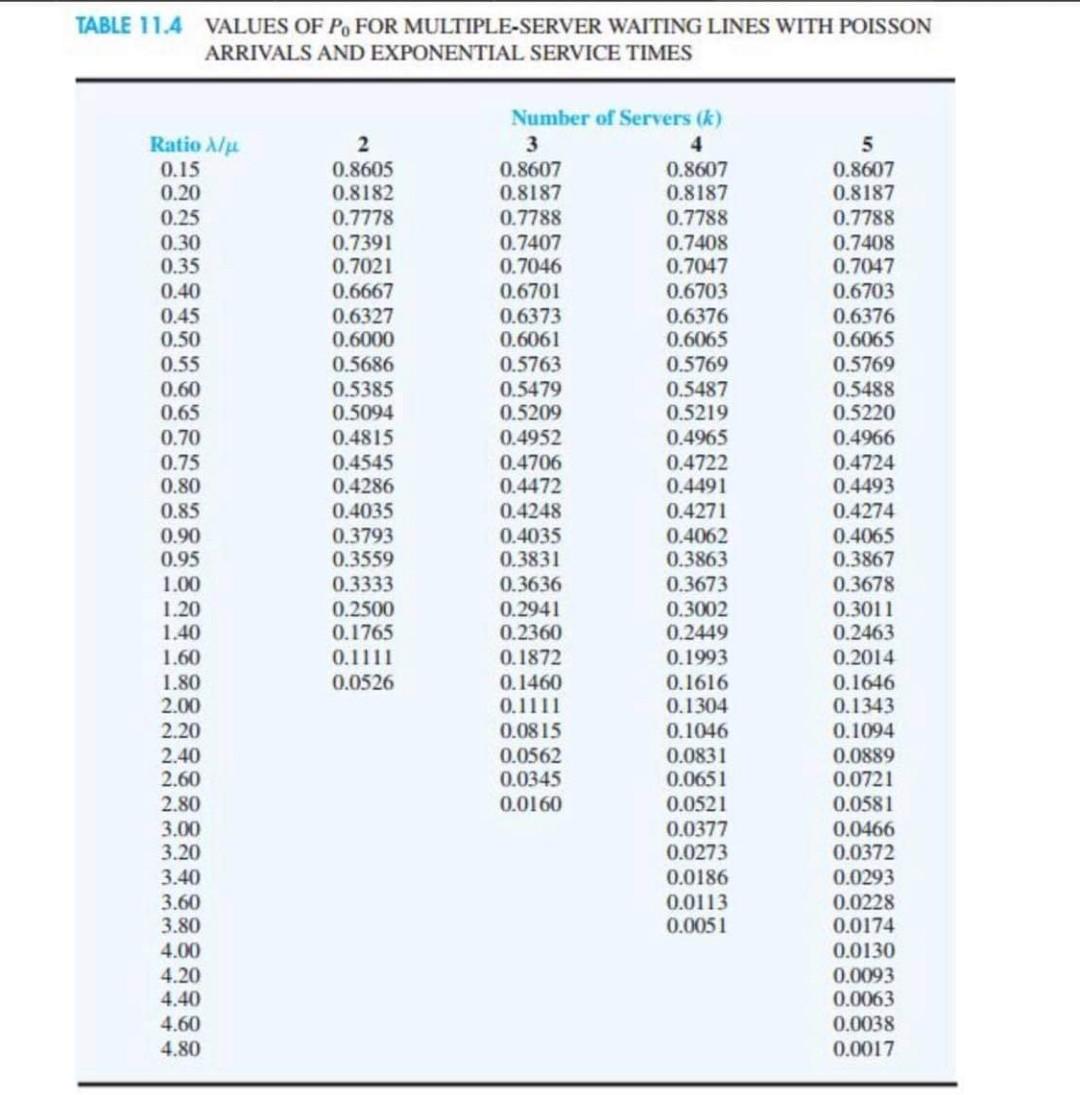

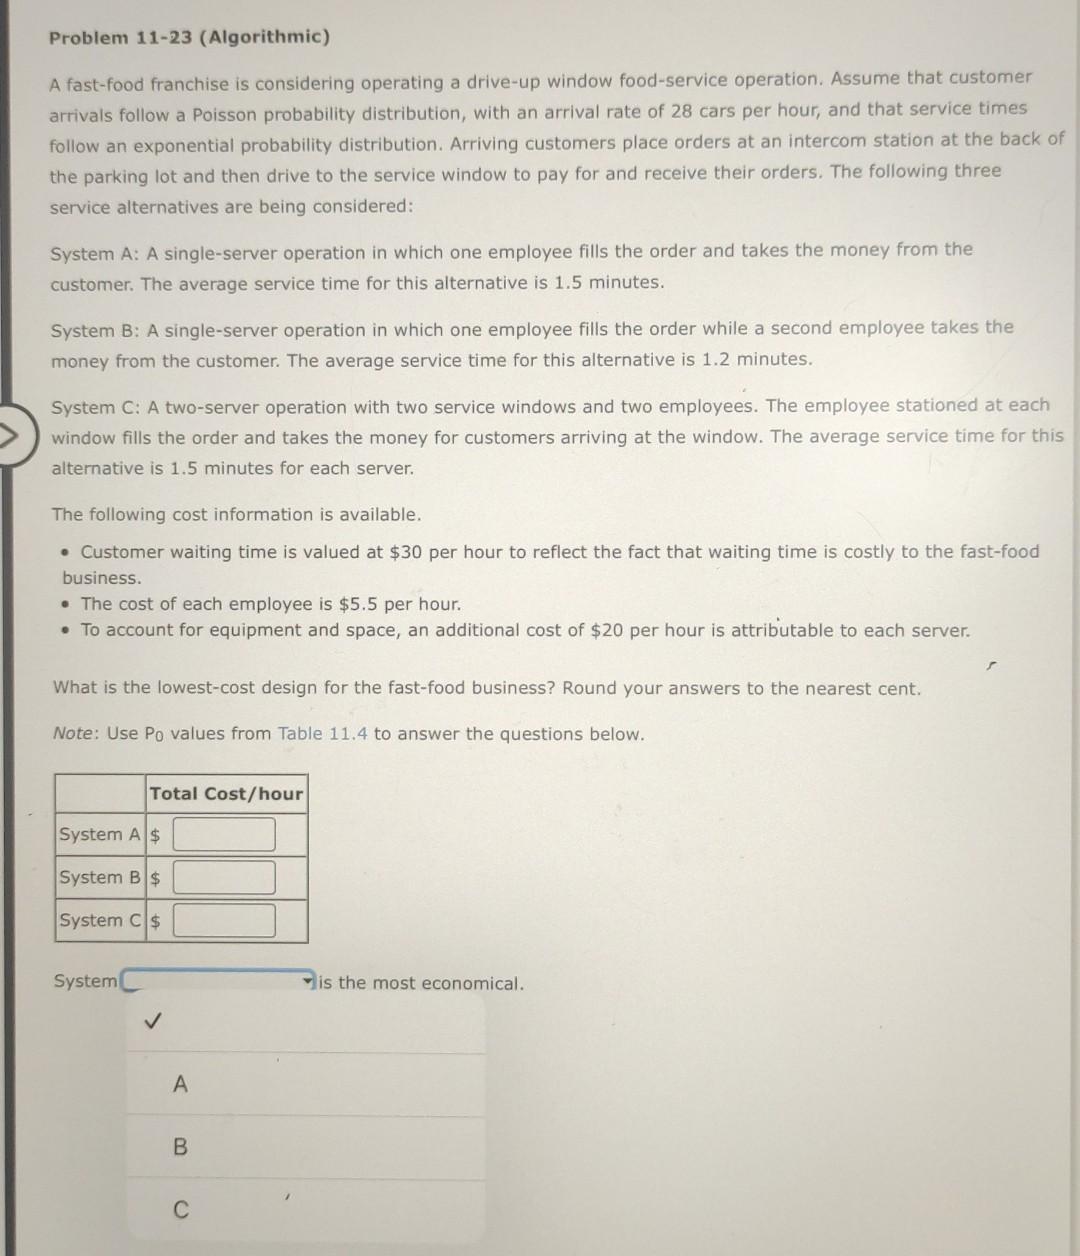
TABLE 11.4 VALUES OF Po FOR MULTIPLE-SERVER WAITING LINES WITH POISSON ARRIVALS AND EXPONENTIAL SERVICE TIMES Number of Servers (k) 2 3 4 5 Ratio / 0.15 0.8605 0.8607 0.8607 0.8607 0.20 0.8182 0.8187 0.8187 0.8187 0.25 0.7778 0.7788 0.7788 0.7788 0.30 0.7391 0.7407 0.7408 0.7408 0.35 0.7021 0.7046 0.7047 0.7047 0.40 0.6667 0.6701 0.6703 0.6703 0.45 0.6327 0.6373 0.6376 0.6376 0.50 0.6000 0.6061 0.6065 0.6065 0.55 0.5686 0.5763 0.5769 0.5769 0.60 0.5385 0.5479 0.5487 0.5488 0.65 0.5094 0.5209 0.5219 0.5220 0.70 0.4815 0.4952 0.4965 0.4966 0.75 0.4545 0.470 0.4722 0.4724 0.80 0.4286 0.4472 0.4491 0.4493 0.85 0.4035 0.4248 0.4271 0.4274 0.90 0.3793 0.4035 0.4062 0.4065 0.95 0.3559 0.3831 0.3863 0.3867 1.00 0.3333 0.3636 0.3673 0.3678 1.20 0.2500 0.2941 0.3002 0.3011 1.40 0.1765 0.2360 0.2449 0.2463 1.60 0.1111 0.1872 0.1993 0.2014 1.80 0.0526 0.1460 0.1616 0.1646 2.00 0.1111 0.1304 0.1343 2.20 0.0815 0.1046 0.1094 2.40 0.0562 0.0831 0.0889 2.60 0.0345 0.0651 0.0721 2.80 0.0160 0.0521 0.0581 3.00 0.0377 0.0466 3.20 0.0273 0.0372 3.40 0.0186 0.0293 3.60 0.0113 0.0228 3.80 0.0051 0.0174 4.00 0.0130 4.20 0.0093 4.40 0.0063 4.60 0.0038 4.80 0.0017 TABLE 11.4 VALUES OF Po FOR MULTIPLE-SERVER WAITING LINES WITH POISSON ARRIVALS AND EXPONENTIAL SERVICE TIMES Number of Servers (k) 2 3 4 5 Ratio / 0.15 0.8605 0.8607 0.8607 0.8607 0.20 0.8182 0.8187 0.8187 0.8187 0.25 0.7778 0.7788 0.7788 0.7788 0.30 0.7391 0.7407 0.7408 0.7408 0.35 0.7021 0.7046 0.7047 0.7047 0.40 0.6667 0.6701 0.6703 0.6703 0.45 0.6327 0.6373 0.6376 0.6376 0.50 0.6000 0.6061 0.6065 0.6065 0.55 0.5686 0.5763 0.5769 0.5769 0.60 0.5385 0.5479 0.5487 0.5488 0.65 0.5094 0.5209 0.5219 0.5220 0.70 0.4815 0.4952 0.4965 0.4966 0.75 0.4545 0.470 0.4722 0.4724 0.80 0.4286 0.4472 0.4491 0.4493 0.85 0.4035 0.4248 0.4271 0.4274 0.90 0.3793 0.4035 0.4062 0.4065 0.95 0.3559 0.3831 0.3863 0.3867 1.00 0.3333 0.3636 0.3673 0.3678 1.20 0.2500 0.2941 0.3002 0.3011 1.40 0.1765 0.2360 0.2449 0.2463 1.60 0.1111 0.1872 0.1993 0.2014 1.80 0.0526 0.1460 0.1616 0.1646 2.00 0.1111 0.1304 0.1343 2.20 0.0815 0.1046 0.1094 2.40 0.0562 0.0831 0.0889 2.60 0.0345 0.0651 0.0721 2.80 0.0160 0.0521 0.0581 3.00 0.0377 0.0466 3.20 0.0273 0.0372 3.40 0.0186 0.0293 3.60 0.0113 0.0228 3.80 0.0051 0.0174 4.00 0.0130 4.20 0.0093 4.40 0.0063 4.60 0.0038 4.80 0.0017 Problem 11-23 (Algorithmic) A fast-food franchise is considering operating a drive-up window food-service operation. Assume that customer arrivals follow a Poisson probability distribution, with an arrival rate of 28 cars per hour, and that service times follow an exponential probability distribution. Arriving customers place orders at an intercom station at the back of the parking lot and then drive to the service window to pay for and receive their orders. The following three service alternatives are being considered: System A: A single-server operation in which one employee fills the order and takes the money from the customer. The average service time for this alternative is 1.5 minutes. System B: A single-server operation in which one employee fills the order while a second employee takes the money from the customer. The average service time for this alternative is 1.2 minutes. System C: A two-server operation with two service windows and two employees. The employee stationed at each window fills the order and takes the money for customers arriving at the window. The average service time for this alternative is 1.5 minutes for each server. The following cost information is available. Customer waiting time is valued at $30 per hour to reflect the fact that waiting time is costly to the fast-food business. The cost of each employee is $5.5 per hour. To account for equipment and space, an additional cost of $20 per hour is attributable to each server. What is the lowest-cost design for the fast-food business? Round your answers to the nearest cent. Note: Use Po values from Table 11.4 to answer the questions below. Total Cost/hour System A $ System B $ System C $ System is the most economical. A B C
Step by Step Solution
There are 3 Steps involved in it
1 Expert Approved Answer
Step: 1 Unlock

Question Has Been Solved by an Expert!
Get step-by-step solutions from verified subject matter experts
Step: 2 Unlock
Step: 3 Unlock