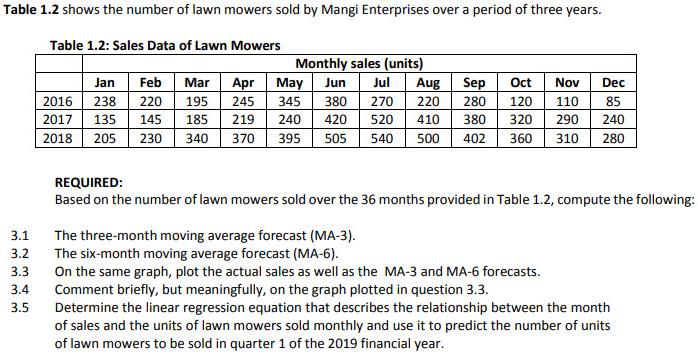
Table 1.2 shows the number of lawn mowers sold by Mangi Enterprises over a period of...
Fantastic news! We've Found the answer you've been seeking!
Question:
Transcribed Image Text:
Table 1.2 shows the number of lawn mowers sold by Mangi Enterprises over a period of three years. Table 1.2: Sales Data of Lawn Mowers Monthly sales (units) Feb Mar Jul Sep Oct Dec Jan Apr May 345 Jun Aug Nov 220 380 2016 238 195 245 270 220 280 120 110 85 410 2017 135 185 219 240 420 520 380 320 290 240 145 505 2018 205 230 340 370 395 500 402 360 310 280 540 REQUIRED: Based on the number of lawn mowers sold over the 36 months provided in Table 1.2, compute the following: 3.1 The three-month moving average forecast (MA-3). The six-month moving average forecast (MA-6). On the same graph, plot the actual sales as well as the MA-3 and MA-6 forecasts. Comment briefly, but meaningfully, on the graph plotted in question 3.3. Determine the linear regression equation that describes the relationship between the month of sales and the units of lawn mowers sold monthly and use it to predict the number of units of lawn mowers to be sold in quarter 1 of the 2019 financial year. 3.2 3.3 3.4 3.5 Table 1.2 shows the number of lawn mowers sold by Mangi Enterprises over a period of three years. Table 1.2: Sales Data of Lawn Mowers Monthly sales (units) Feb Mar Jul Sep Oct Dec Jan Apr May 345 Jun Aug Nov 220 380 2016 238 195 245 270 220 280 120 110 85 410 2017 135 185 219 240 420 520 380 320 290 240 145 505 2018 205 230 340 370 395 500 402 360 310 280 540 REQUIRED: Based on the number of lawn mowers sold over the 36 months provided in Table 1.2, compute the following: 3.1 The three-month moving average forecast (MA-3). The six-month moving average forecast (MA-6). On the same graph, plot the actual sales as well as the MA-3 and MA-6 forecasts. Comment briefly, but meaningfully, on the graph plotted in question 3.3. Determine the linear regression equation that describes the relationship between the month of sales and the units of lawn mowers sold monthly and use it to predict the number of units of lawn mowers to be sold in quarter 1 of the 2019 financial year. 3.2 3.3 3.4 3.5
Expert Answer:
Related Book For
Elementary Statistics A step by step approach
ISBN: 978-0073386102
8th edition
Authors: Allan Bluman
Posted Date:
Students also viewed these accounting questions
-
The table below shows the number of students (in thousands) participating in various programs at both two-year and four-year institutions. At = 0.05, can it be concluded that there is a relationship...
-
The following set of data shows the number of alcoholic drinks that students at a Kansas university reported they had consumed in the past month: a. Assume the data set is a sample. Calculate the...
-
The table given below shows the number of licensed U.S. drivers (in millions) by age and by sex (www.dot.gov). a) What percent of total drivers are under 20? b) What percent of total drivers are...
-
On January 1, 2018, JKJ purchased a 1,000 acre farm with a building. The asking price was $2,600,000. Approximately 15 percent of the total value of the farm was allocable to the building and the...
-
On January 1, 2018, the general ledger of ACME Fireworks includes the following account balances: During January 2018, the following transactions occur: January 2 Sold gift cards totaling $8,000. The...
-
Which accounting period would always include an equal number of Mondays? a. 28-day b. Month c. Quarter d. Annual
-
Refer to the information in QS 13-4. Use that information for Tide Corporation to determine the 2016 and 2017 common-size percents for cost of goods sold using net sales as the base. Data From QS...
-
Sarah Warren currently holds 400 shares of Nutri-Foods. The firm has 40,000 shares outstanding. The firm most recently had earnings available for common stockholders of $80,000, and its stock has...
-
A bug sits on a record moving at a constant angular speed of 0 = 3.5 rad/s. Starting at t = 0 s, the record player is turned off and is given a constant angular acceleration of = 1.0 rad/s 2 . The...
-
The proposed rates were not in the range the CEO expected given the pricing analysis. The CEO has asked the pricing actuary to verify the total projected loss cost excluding potential large storm...
-
Suppose you are to open a Zero waste vegan restaurant in a suitable place in Dhaka city. Now answer the following questions: If you consider this business a start-up, where would you want to see this...
-
In setting monetary policy, which central bankone that operates according to a Taylor rule or one that operates by inflation targetingis likely to respond more directly to a financial crisis? Explain.
-
Suppose the United States and Japan are the only two trading countries in the world. What will happen to the value of the U.S. dollar if the following occur, other things equal? a. Japan relaxes some...
-
Suppose the economy is currently suffering from an output gap and the Federal Reserve uses an expansionary monetary policy to close that gap. Describe the short-run effect of this policy on the...
-
Draw an organizational chart of the business school or college that you attend. Outline its major roles and functions. How differentiated is it? Do you think the distribution of authority and...
-
In each of the following scenarios, suppose that the two nations are the only trading nations in the world. Given inflation and the change in the nominal exchange rate, which nations goods become...
-
How do environmental laws/regulations protect humans and/or environment? What is the best compliance method or strategy for enforcement of environmentallaws/regs? Describe a positiveoutcome to...
-
(8%) Problem 6: A student attaches a f= 3.5 kHz oscillator to one end of a metal rail of length L = 25 m. The student turns on the oscillator and uses a piezoelectric gauge at the other end to...
-
The national average SAT score (for Verbal and Math) is 1028. Suppose that nothing is known about the shape of the distribution and that the standard deviation is 100. If a random sample of 200...
-
Americans ate an average of 25.7 pounds of confectionary products each last year and spent an average of $61.50 per person doing so. If the standard deviation for consumption is 3.75 pounds and the...
-
A sample of 12 drivers shows the time that they spent (in minutes) stopped in rush-hour traffic on a specific snowy day last winter. 52 56 53 61 49 51 53 58 53 60 71 58 Find the range, variance, and...
-
Consider the data file mroz on working wives and the model \(\ln (W A G E)=\beta_{1}+\beta_{2} E D U C+\) \(\beta_{3} E X P E R+e\). Use the 428 observations on married women who participate in the...
-
Using the data from Table 2, construct a \(95 \%\) confidence interval estimate of the mean difference, \(\mu_{d}\). By Hand Approach Step 1 Compute the differenced data. Because the sample size is...
-
Problem Decide whether the sampling method is independent or dependent. Then determine whether the response variable is qualitative or quantitative. (a) Joliet Junior College decided to implement a...
Study smarter with the SolutionInn App