

Question: Using the data from Table 2, construct a (95 %) confidence interval estimate of the mean difference, (mu_{d}). By Hand Approach Step 1 Compute the
Using the data from Table 2, construct a \(95 \%\) confidence interval estimate of the mean difference, \(\mu_{d}\).
By Hand Approach
Step 1 Compute the differenced data. Because the sample size is small, we must verify that the differenced data come from a population that is approximately normal with no outliers.
Step 2 Compute the sample mean difference, \(\bar{d}\), and the sample standard deviation difference, \(s_{d}\).
Step 3 Determine the critical value, \(t_{\frac{\alpha}{2}}\), with \(\alpha=0.05\) and \(n-1\) degrees of freedom.
Step 4 Use Formula (1) to determine the lower and upper bounds.
Step 5 Interpret the results.
Technology Approach
Step 1 Compute the differenced data. Because the sample size is small, verify the differenced data come from a population that is approximately normal with no outliers.
Step 2 Use a statistical spreadsheet or graphing calculator with advanced statistical features to obtain the confidence interval. We will use a TI-84 Plus \(\mathrm{C}\) to construct the confidence interval. The steps for constructing confidence intervals using StatCrunch, Minitab, Excel, and the TI-83/84 graphing calculators are given in the Technology Step-by-Step.
Step 3 Interpret the result.
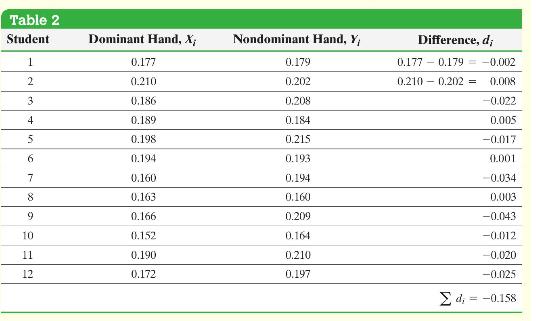

Table 2 Student Dominant Hand, X; Nondominant Hand, Y Difference, d 1 0.177 0.179 0.177 0.179 = -0.002 2 0.210 0.202 0.210 0.202 = 0.008 3 0.186 0.208 -0.022 4 0.189 0.184 0.005 5 0.198 0.215 -0.017 6 0.194 0.193 7 0.160 0.194 0.001 -0.034 8 0.163 0.160 0.003 9 0.166 0.209 -0.043 10 0.152 0.164 -0.012 11 0.190 0.210 -0.020 12 0.172 0.197 -0.025 4, = -0.158
Step by Step Solution
3.38 Rating (145 Votes )
There are 3 Steps involved in it
ByHand Step 1 We computed the differenced data and verified that they come from a population that is approximately normally distributed with no outlie... View full answer

Get step-by-step solutions from verified subject matter experts