

Question: TABLE 12-18 U.S. Youth Risk Behavior Survey, 2009 Grades Behavior A's B's C's D's or F's Carried a weapon at least once in the past
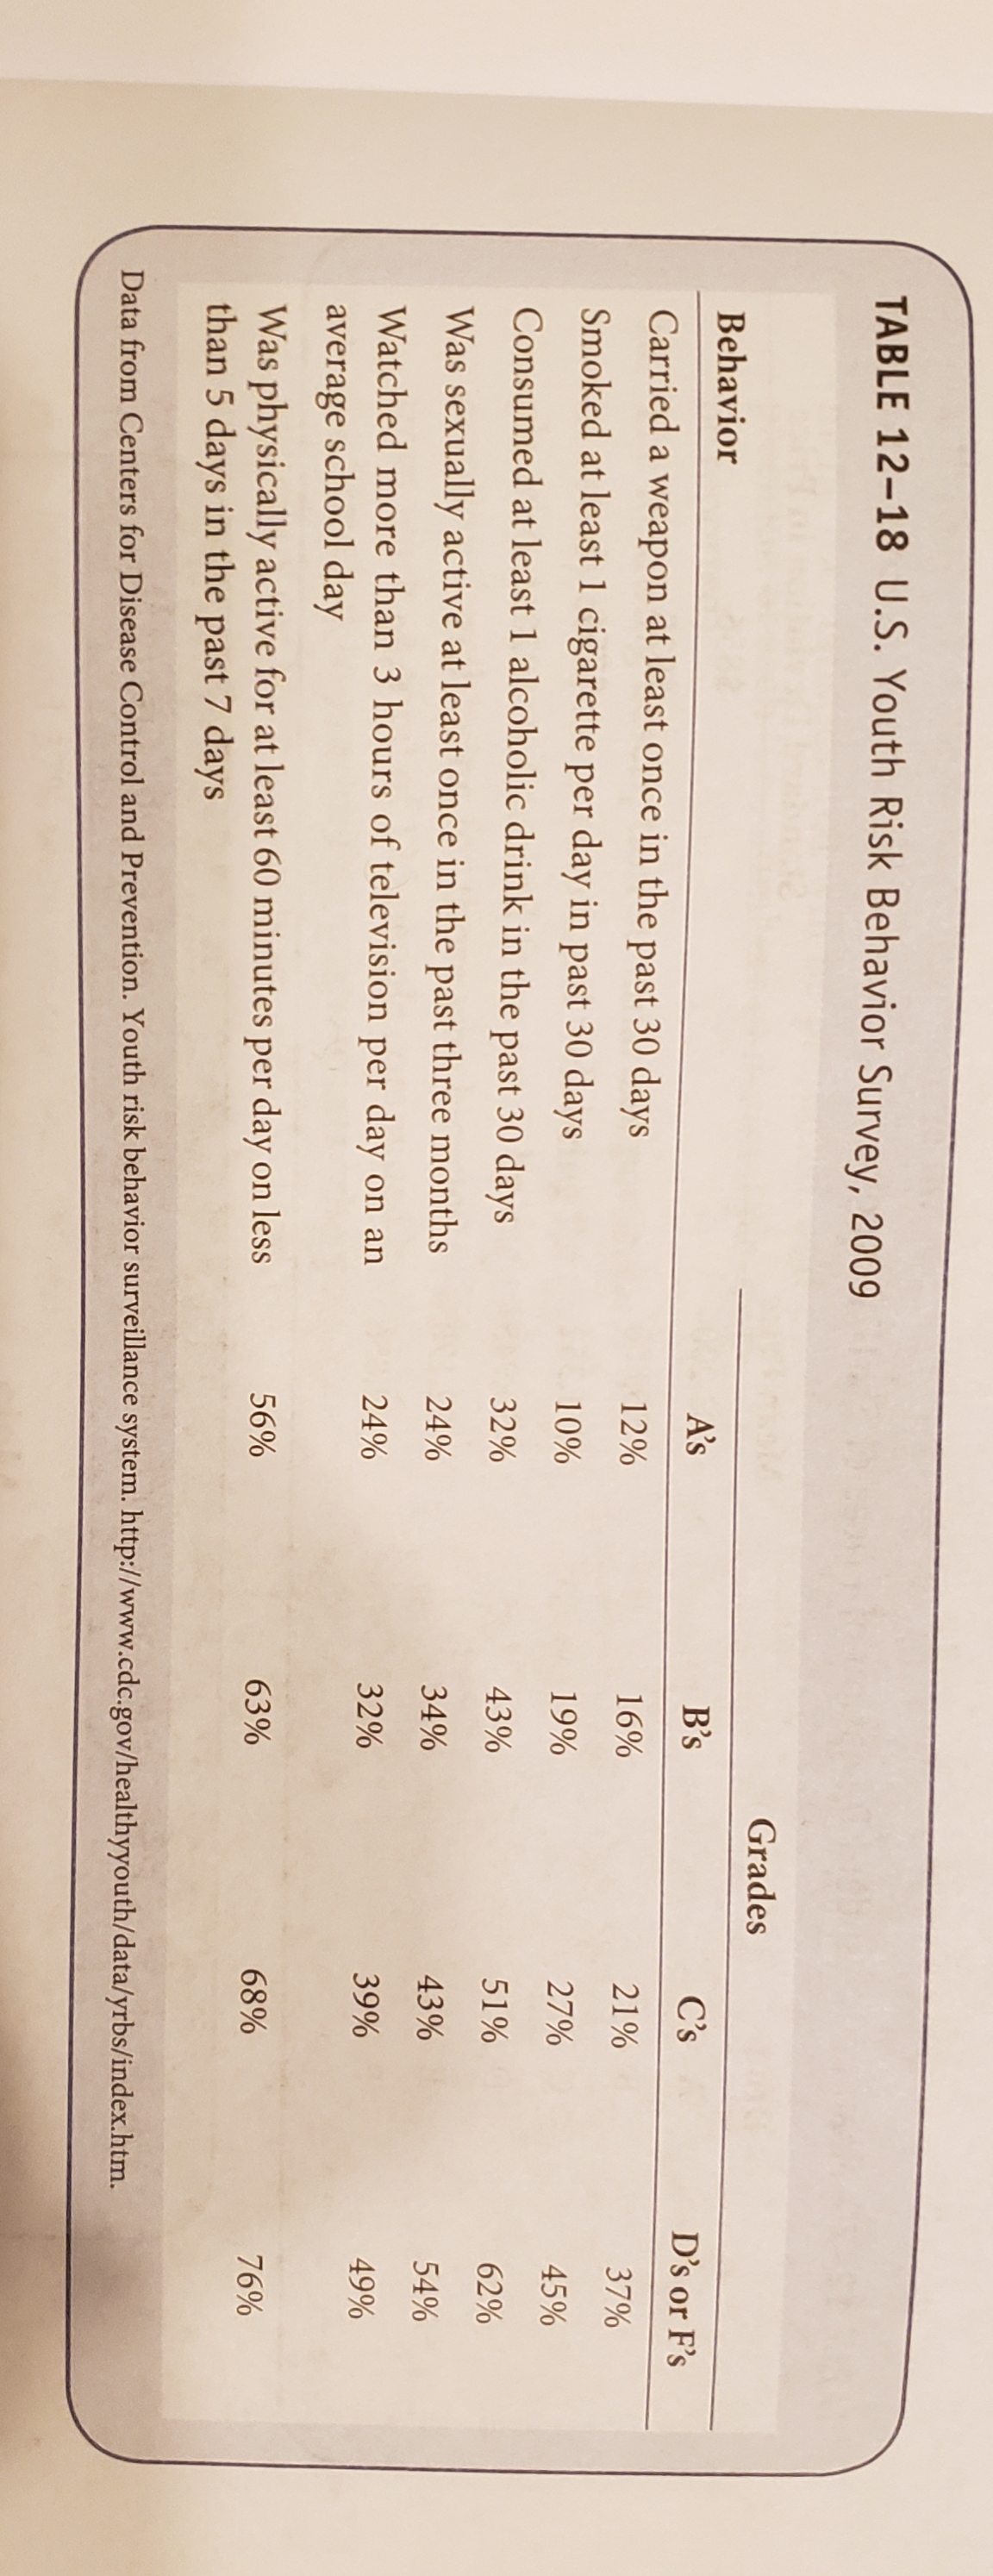
TABLE 12-18 U.S. Youth Risk Behavior Survey, 2009 Grades Behavior A's B's C's D's or F's Carried a weapon at least once in the past 30 days 12% 16% 21% 37% Smoked at least 1 cigarette per day in past 30 days 10% 19% 27% 45% Consumed at least 1 alcoholic drink in the past 30 days 32% 43% 51% 62% Was sexually active at least once in the past three months 24% 34% 43% 54% Watched more than 3 hours of television per day on an 24% 32% 39% 49% average school day Was physically active for at least 60 minutes per day on less 56% 63% 68% 76% than 5 days in the past 7 days Data from Centers for Disease Control and Prevention. Youth risk behavior surveillance system. http://www.cdc.gov/healthyyouth/data/yrbs/index.htm.2. The data in Table 12-18 are extracted from the CDC's 2009 Youth Risk Behavior Survey and repre- sent the percentages of students who reported each of the indicated behaviors in 2009, organized by the grades they tended to earn (mostly A's, B's, C's, D's, or F's). Create a graphical display to summarize the associations between behaviors (all six together in one graphical display) and grades
Step by Step Solution
There are 3 Steps involved in it

Get step-by-step solutions from verified subject matter experts