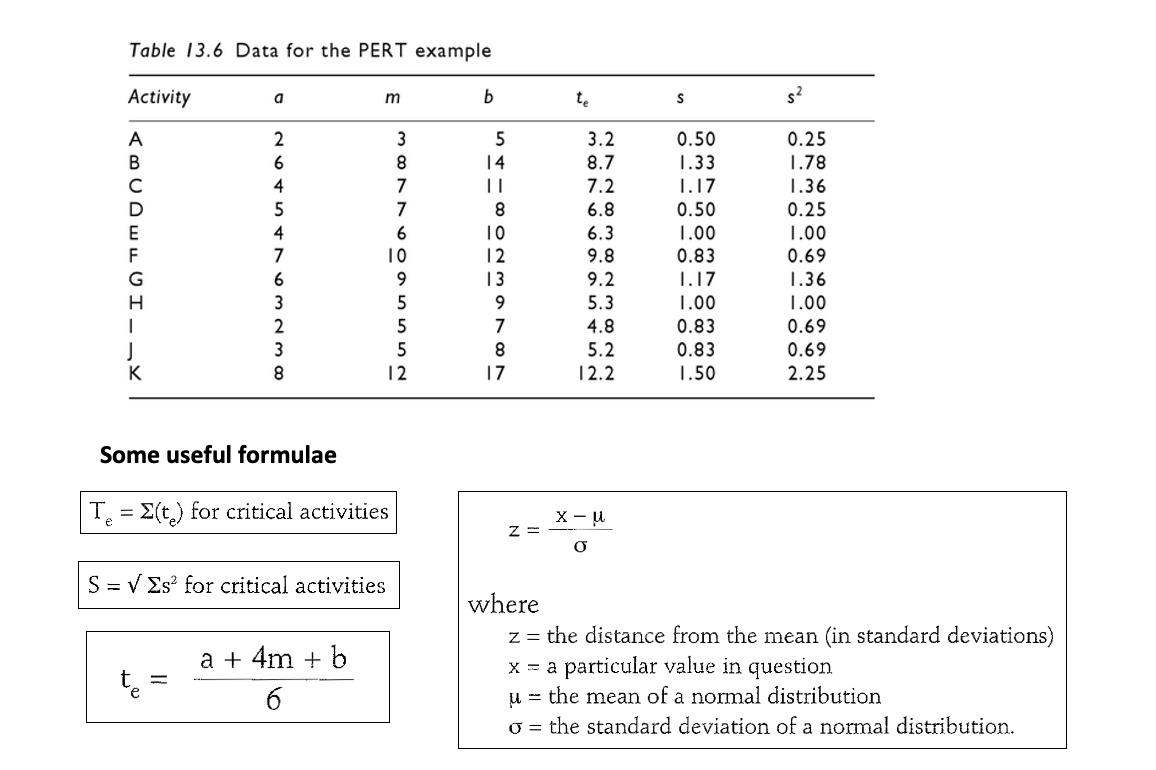
Question: Table 13.6 Data for the PERT example Activity a m b te S s2 B 5 14 0.50 1.33 1.17 0.50 8 1.00 IO TIMU

Table 13.6 Data for the PERT example Activity a mTable 13.6 Data for the PERT example Activity a m

Table 13.6 Data for the PERT example Activity a m b te S s2 B 5 14 0.50 1.33 1.17 0.50 8 1.00 IO TIMU WN WOVA AON 3 8 7 7 6 10 9 5 5 5 12 - ONMANO 3.2 8.7 7.2 6.8 6.3 9.8 9.2 5.3 4.8 5.2 12.2 0.83 1.17 1.00 0.83 0.83 1.50 0.25 1.78 1.36 0.25 1.00 0.69 1.36 1.00 0.69 0.69 2.25 1 J K 3 8 Some useful formulae Te = {(t) for critical activities X-u Z- o S = V 2s for critical activities a + 4m + b where z = the distance from the mean (in standard deviations) x = a particular value in question u = the mean of a normal distribution o = the standard deviation of a normal distribution. 6 Exercise 13.3 Information on durations of activities in a PERT schedule (Figure 13.5), and values of means, standard deviations and variances are given in Table 13.6. What is the probability that this project will be completed in 32 weeks? | A D F 1 START B E G J END H K Figure 13.5 The PERT schedule

Step by Step Solution

There are 3 Steps involved in it

1 Expert Approved Answer
Step: 1 Unlock blur-text-image
Question Has Been Solved by an Expert!

Get step-by-step solutions from verified subject matter experts

Step: 2 Unlock
Step: 3 Unlock

Students Have Also Explored These Related General Management Questions!