

Question: TABLE 16-4 Given below are EXCEL outputs for various estimated autoregressive models for Coca-Cola's real operating revenues in billions of dollars) from 1975 to 1998.
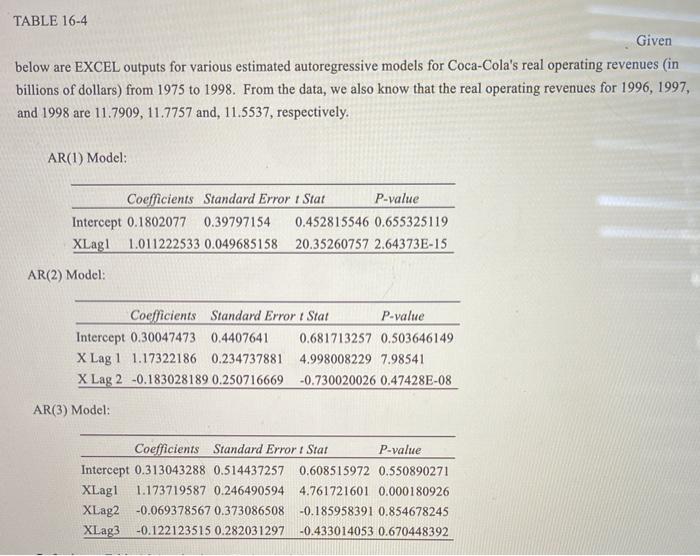
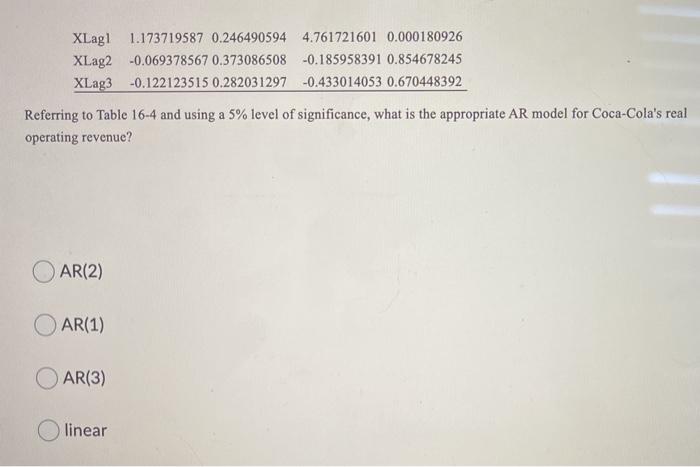
TABLE 16-4 Given below are EXCEL outputs for various estimated autoregressive models for Coca-Cola's real operating revenues in billions of dollars) from 1975 to 1998. From the data, we also know that the real operating revenues for 1996, 1997, and 1998 are 11.7909, 11.7757 and, 11.5537, respectively. AR(1) Model: Coefficients Standard Error Stat P-value Intercept 0.1802077 0.39797154 0.452815546 0.655325119 XLagl 1.011222533 0.049685158 20.35260757 2.64373E-15 AR(2) Model: Coefficients Standard Error Stat P-value Intercept 0.30047473 0.4407641 0.681713257 0.503646149 X Lag 1 1.17322186 0.234737881 4.998008229 7.98541 X Lag 2 -0.183028189 0.250716669 -0.730020026 0.47428E-08 AR(3) Model: Coefficients Standard Error : Stat P-value Intercept 0.313043288 0.514437257 0.608515972 0.550890271 XLagi 1.173719587 0.246490594 4.761721601 0.000180926 XLag2 -0.069378567 0.373086508 -0.185958391 0.854678245 XLag3 -0.122123515 0.282031297 -0.433014053 0.670448392 XLagl 1.173719587 0.246490594 4.761721601 0.000180926 XLag2-0.069378567 0.373086508 -0.185958391 0.854678245 XLag3 -0.122123515 0.282031297 -0.433014053 0.670448392 Referring to Table 16-4 and using a 5% level of significance, what is the appropriate AR model for Coca-Cola's real operating revenue? O AR(2) AR(1) AR(3) linear TABLE 16-4 Given below are EXCEL outputs for various estimated autoregressive models for Coca-Cola's real operating revenues in billions of dollars) from 1975 to 1998. From the data, we also know that the real operating revenues for 1996, 1997, and 1998 are 11.7909, 11.7757 and, 11.5537, respectively. AR(1) Model: Coefficients Standard Error Stat P-value Intercept 0.1802077 0.39797154 0.452815546 0.655325119 XLagl 1.011222533 0.049685158 20.35260757 2.64373E-15 AR(2) Model: Coefficients Standard Error Stat P-value Intercept 0.30047473 0.4407641 0.681713257 0.503646149 X Lag 1 1.17322186 0.234737881 4.998008229 7.98541 X Lag 2 -0.183028189 0.250716669 -0.730020026 0.47428E-08 AR(3) Model: Coefficients Standard Error : Stat P-value Intercept 0.313043288 0.514437257 0.608515972 0.550890271 XLagi 1.173719587 0.246490594 4.761721601 0.000180926 XLag2 -0.069378567 0.373086508 -0.185958391 0.854678245 XLag3 -0.122123515 0.282031297 -0.433014053 0.670448392 XLagl 1.173719587 0.246490594 4.761721601 0.000180926 XLag2-0.069378567 0.373086508 -0.185958391 0.854678245 XLag3 -0.122123515 0.282031297 -0.433014053 0.670448392 Referring to Table 16-4 and using a 5% level of significance, what is the appropriate AR model for Coca-Cola's real operating revenue? O AR(2) AR(1) AR(3) linear
Step by Step Solution
There are 3 Steps involved in it

Get step-by-step solutions from verified subject matter experts