

Question: Table 2 : Calculated and measured values 1 0 . Connect the CHO of the oscilloscope across the resistor. Measure and record the peak to
Table : Calculated and measured values
Connect the CHO of the oscilloscope across the resistor. Measure and record the peak to peak voltage drop mathrmVmathrmR in table above at the frequencies in Table
Draw the frequency response curve from the above results. Frequency will be on X axis; VR will be on Y axis. Provide appropriate axis labels and plot title.
Disconnect the oscilloscope from the circuit.
Connect Al; Alacross the capacitor. Note: Analog input channels are located at the top left hand connector on the prototyping board. Use connecting wires.
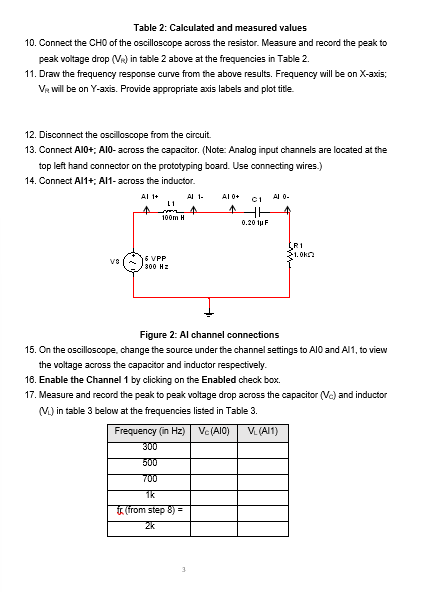
Connect Al; Alacross the inductor.
Figure : Al channel connections
On the oscilloscope, change the source under the channel settings to AlO and Al to view the voltage across the capacitor and inductor respectively.
Enable the Channel by clicking on the Enabled check box.
Measure and record the peak to peak voltage drop across the capacitor mathrmVmathrmc and inductor leftVLright in table below at the frequencies listed in Table
Step by Step Solution
There are 3 Steps involved in it
1 Expert Approved Answer
Step: 1 Unlock

Question Has Been Solved by an Expert!
Get step-by-step solutions from verified subject matter experts
Step: 2 Unlock
Step: 3 Unlock