

Question: Do the following. 1. 2. 3. 4. Table 2 Cosmetic Sales Data for Exercise 3.12 t 1 2 3 4 Xt 5.00 5.06 5.12
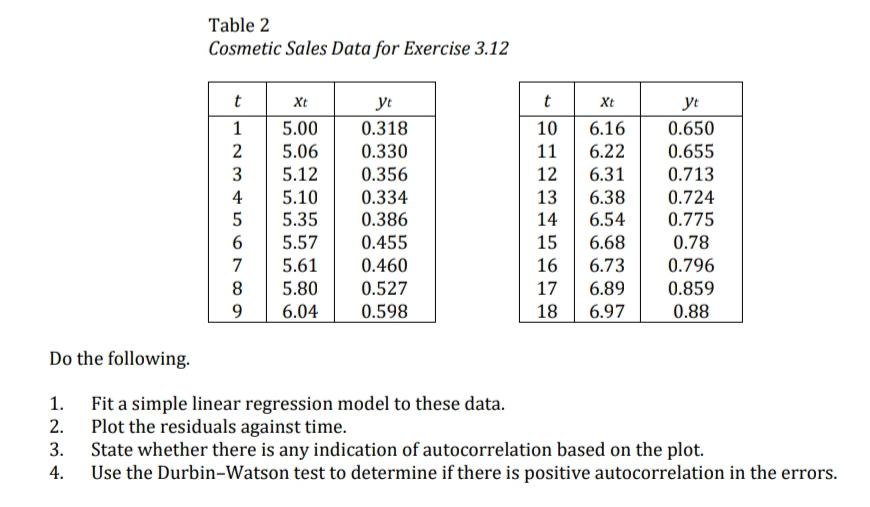
Do the following. 1. 2. 3. 4. Table 2 Cosmetic Sales Data for Exercise 3.12 t 1 2 3 4 Xt 5.00 5.06 5.12 5.10 5 5.35 6 5.57 7 5.61 8 5.80 9 6.04 yt 0.318 0.330 0.356 0.334 0.386 0.455 0.460 0.527 0.598 Xt 6.16 6.22 6.31 10 11 12 13 6.38 14 6.54 6.68 6.73 15 16 17 6.89 18 6.97 yt 0.650 0.655 0.713 0.724 0.775 0.78 0.796 0.859 0.88 Fit a simple linear regression model to these data. Plot the residuals against time. State whether there is any indication of autocorrelation based on the plot. Use the Durbin-Watson test to determine if there is positive autocorrelation in the errors.
Step by Step Solution
There are 3 Steps involved in it
Answer 1 Fit a Simple Linear Regression Model to These Data The purpose of a simple linear regression model is to assess the relationship between two variables In this case the data consists of time t ... View full answer

Get step-by-step solutions from verified subject matter experts