

Question: Table 2: o . Table 1 14 12 10 14 12 10 Number of Hours Number of Hours Which graph Show a proportional relationship? 5]
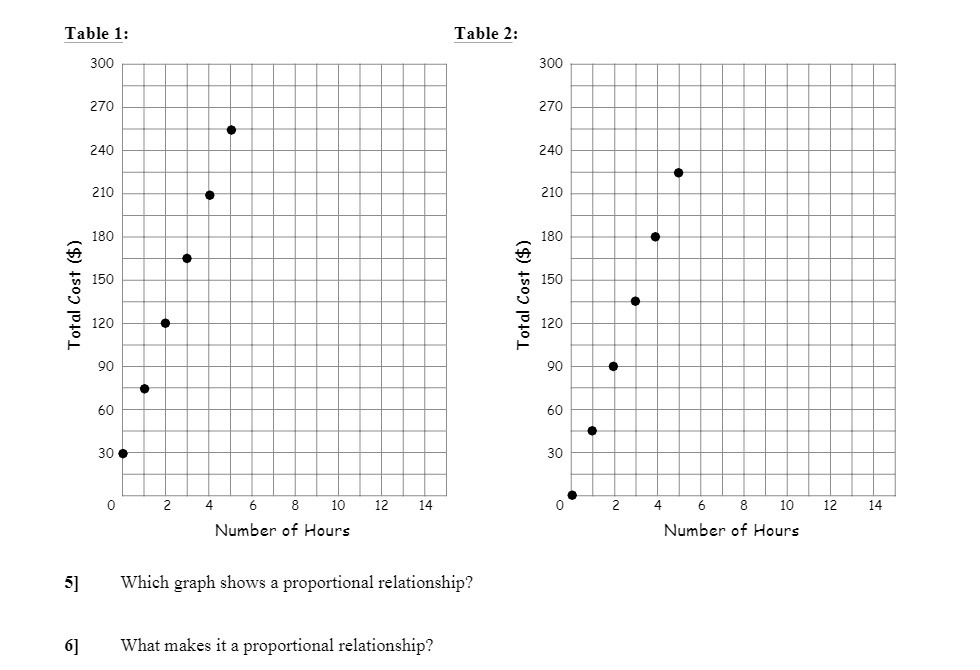
Table 2: o . Table 1 14 12 10 14 12 10 Number of Hours Number of Hours Which graph Show a proportional relationship? 5] What makes it a proportional relationship? 6]
Step by Step Solution
There are 3 Steps involved in it
1 Expert Approved Answer
Step: 1 Unlock

Question Has Been Solved by an Expert!
Get step-by-step solutions from verified subject matter experts
Step: 2 Unlock
Step: 3 Unlock