

Question: TABLE 2 . Soil Properties W 5 0 denotes Wagner 5 0 ; OTT, Ottawa; W 1 8 , Wagner 1 8 ; WM 1
TABLE Soil Properties
W denotes Wagner ; OTT, Ottawa; W Wagner ; WM
Wagner mix ; WM Wagner mix ; and WM Wagner mix
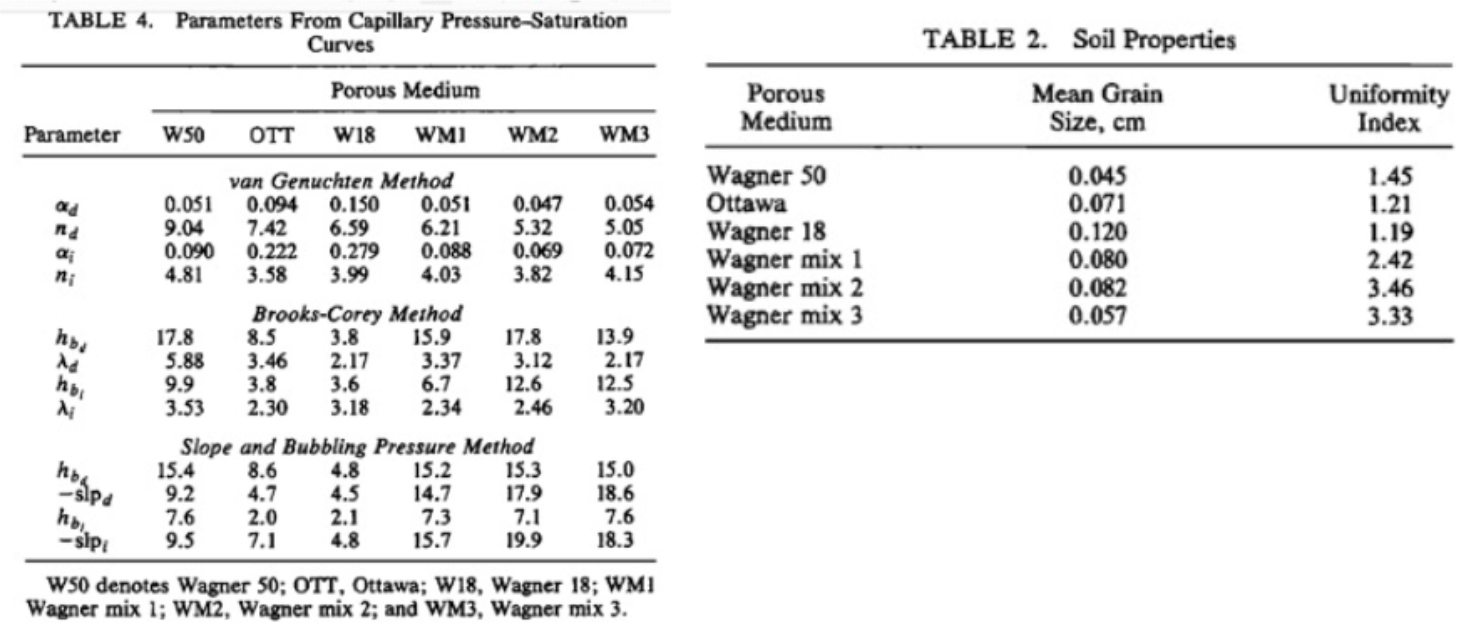
we discussed how we approximate the relationship between the capillary pressure and
the residual saturation with relationships from van Genuchten and Brooks and Corey. Several
researchers measured the capillary pressuresaturation curves for six soil and sediment samples
rrrr
Patm
gravity
rr
r
rr
rr
and fit both the van Genuchten and the Brooks and Corey models to the data See Table
below Using the van Genuchten parameters given in this table, plot the capillary pressure
saturation curves for drainage for all six samples on the same plot. Now plot the capillary
pressuresaturation curves for wetting for all six samples on the same plot.
b Based on the drainage curves, what samples do you expect to have the largest pore size, the
smallest pore size, the widest distribution of pore sizes, the narrowest distribution of pore sizes?
How do your expectations compare to the mean grain size and the grain uniformity index of the
different samples presented in Table above, why?
Step by Step Solution
There are 3 Steps involved in it
1 Expert Approved Answer
Step: 1 Unlock

Question Has Been Solved by an Expert!
Get step-by-step solutions from verified subject matter experts
Step: 2 Unlock
Step: 3 Unlock