

Question: Table 2-2 Year 1 Year 2 Quantity Price Quantity Price Apples Peaches 100 300 $0.05 $0.03 130 $0.06 270 $0.04 1) Refer to above
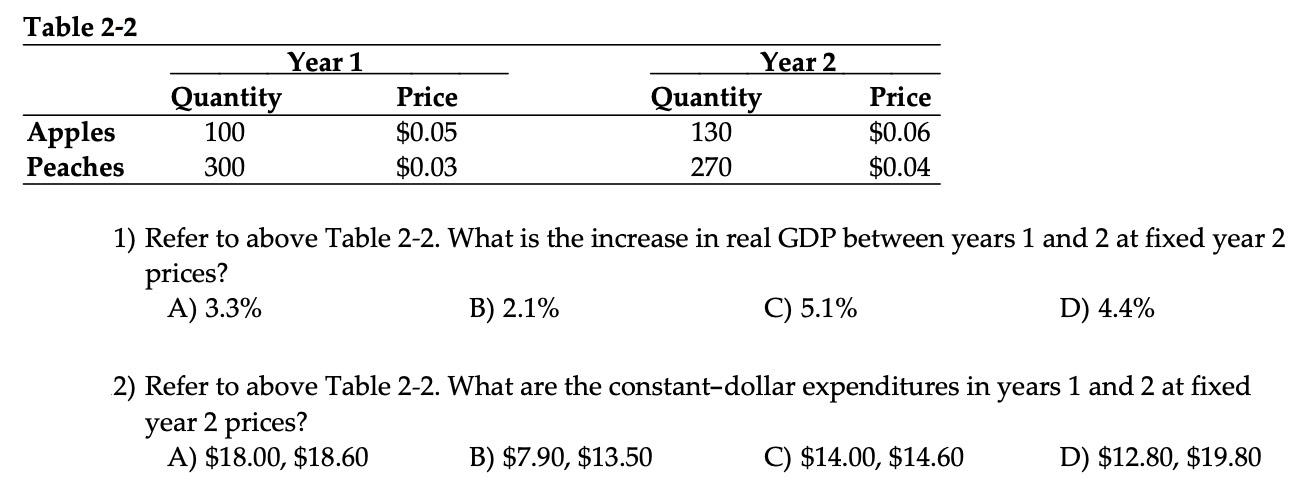
Table 2-2 Year 1 Year 2 Quantity Price Quantity Price Apples Peaches 100 300 $0.05 $0.03 130 $0.06 270 $0.04 1) Refer to above Table 2-2. What is the increase in real GDP between years 1 and 2 at fixed prices? A) 3.3% B) 2.1% C) 5.1% D) 4.4% year 2 2) Refer to above Table 2-2. What are the constant-dollar expenditures in years 1 and 2 at fixed year 2 prices? A) $18.00, $18.60 B) $7.90, $13.50 C) $14.00, $14.60 D) $12.80, $19.80
Step by Step Solution
There are 3 Steps involved in it
1 Expert Approved Answer
Step: 1 Unlock

Question Has Been Solved by an Expert!
Get step-by-step solutions from verified subject matter experts
Step: 2 Unlock
Step: 3 Unlock