

Question: Table 2.5 showing financial statement data and stock price data for Mydeco Corp. a. In what year was Mydecos net income the lowest? b. In
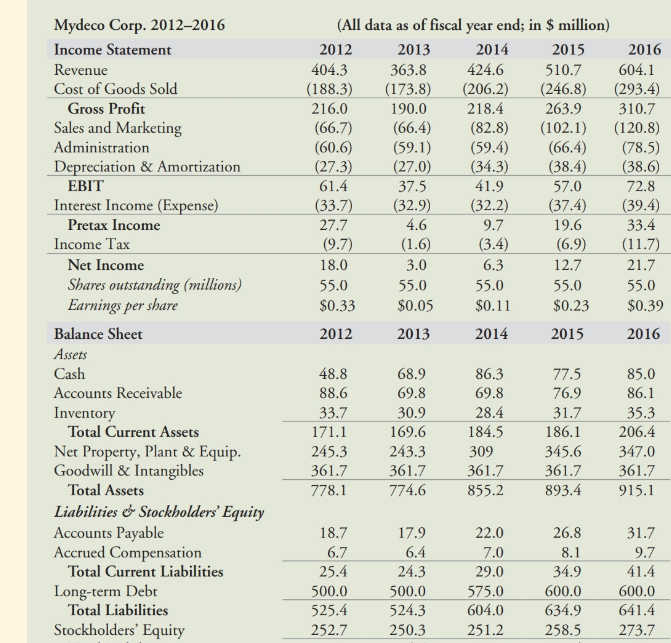
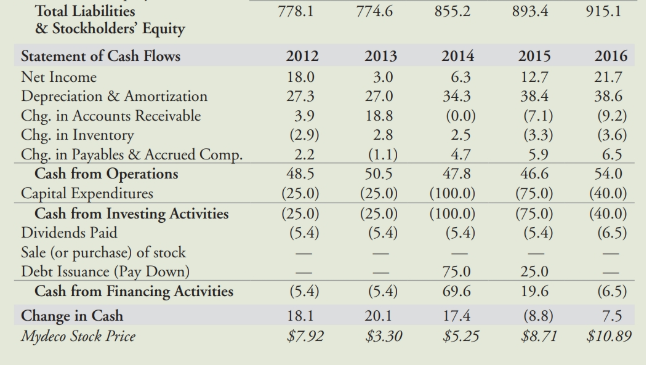
Table 2.5 showing financial statement data and stock price data for Mydeco Corp.
a. In what year was Mydecos net income the lowest?
b. In what year did Mydeco need to reduce its cash reserves?
c. Why did Mydeco need to reduce its cash reserves in a year when net income was reasonably high?
Mydeco Corp. 2012-2016 (All data as of fiscal year end; in $ million) 2012 Income Statement Revenue Cost of Goods Sold(188.3) (173.8) (206.2) (246.8) (293.4) 2013 363.8 2014 424.6 2015 510.7 2016 604.1 404.3 Gross Profit Sales and Marketing Administration Depreciation& Amortization 216.0 190.0 218.4 263.9 310.7 (66.7) (66.4) (82.8) (102.1) (120.8) (60.6) (59 (59.4) 66.4) (78.5) 27.3 38.4 EBIT 72.8 Interest Income (Expense (33 27.7 (9.7 Pretax Income Income Tax 12.7 $0.23 $0.39 2015 Net Income Shares outstanding (millions) Earnings per sha Balance Sheet Assets Cash Accounts Receivable Inventorv 0.33 2012 48.8 33.7 245.3 $0.05 2013 2014 2016 68.9 69.8 30.9 169.6 243.3 361.7 774.6 86.3 28.4 184.5 309 Total Current Assets 186.1 345.6 347.0 361.7 361.7 893.4 915.1 206.4 Net Property, Plant & Equip Goodwill&Intangibles 361.7 Total Assets Liabilities e& Stockholders' Equity Accounts Payable Accrued Compensation 855.2 26.8 Total Current Liabilities 29.0 575.0 24.3 Long-term Debt 500.0 600.0 524.3 604.0 634.9 641.4 273.7 Total Liabilities Stockholders' Equity 252.7 250.3 251.2 258.5
Step by Step Solution
There are 3 Steps involved in it

Get step-by-step solutions from verified subject matter experts