

Question: Table 3: Model fitting results for Sales Independent variable coefficient std. Error t-value p-value CONSTANT 311.357284 50.258415 6.1951 0.0002 Adv 1.002456 0.253164 3.9597 0.0033 Price
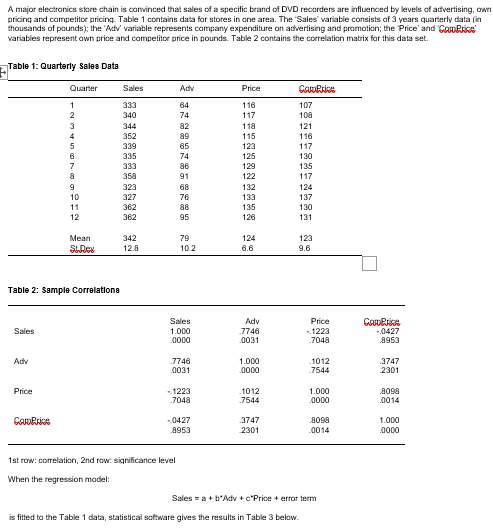
Table 3: Model fitting results for Sales
| Independent variable | coefficient | std. Error | t-value | p-value | |
| CONSTANT | 311.357284 | 50.258415 | 6.1951 | 0.0002 | |
|
| Adv | 1.002456 | 0.253164 | 3.9597 | 0.0033 |
|
| Price | -0.390762 | 0.386936 | -1.0099 | 0.3389 |
| R-SQ. (ADJ.) = | 0.5610 | SE= | 8.864308 |
|
|
|
|
(i) Write down the resulting best fit model and comment on how well the model fits the data. Interpret the R-SQ. (ADJ)
(ii) Test the significance of the independent variables. Interpret the t-values and the p-values.
(iii) What information does the SE statistic in Table 3 provide for this regression model?
A major electronics store chain is convinced that sales of a specific brand of DVD recorders are influenced by levels of advertising, own pricing and competitor pricing Table 1 contains data for stores in one area. The Sales variable consists of 3 years quarterly data in thousands of pounds), the Adv variable represents company expenditure on advertising and promotion; the Price' and Caprice variables represent own price and competitor price in pounds. Table 2 contains the correlation matrix for this data set. Table 1: Quarterly Sales Data Quarter Ad Price 1 Sales 333 340 344 2 3 352 339 335 5 6 7 & 9 10 11 12 64 74 82 89 65 74 86 91 68 76 88 95 116 117 118 115 123 125 129 122 132 133 135 126 Garrice 107 108 121 116 117 130 135 117 124 137 130 131 35a 323 327 362 362 342 Mean Supex 79 102 124 6.6 123 9.6 12.8 Table 2: Sample Correlations Sales Sales 1.000 .0000 Adv .7746 .0031 Price 1223 .7048 Carrie -0427 .8953 Adv .7746 0031 1.000 0000 .1012 .7544 3747 2301 Price 1223 .7048 -1012 .7544 1.000 0000 .8098 .0014 Ganprice -0427 8953 3747 2301 8098 0014 1.000 .0000 1st row.correlation, 2nd row. significance level When the regression model: Sales = a + b Adv+c"Prion error term is fitted to the Table 1 data, statistical software gives the results in Table 3 belowStep by Step Solution
There are 3 Steps involved in it
1 Expert Approved Answer
Step: 1 Unlock

Question Has Been Solved by an Expert!
Get step-by-step solutions from verified subject matter experts
Step: 2 Unlock
Step: 3 Unlock