

Question: Table 3 Original experimental dataThe calibration data of the S O 2 sensor is shown in Table 1 . ( Original experimental data is shown
Table Original experimental dataThe calibration data of the sensor is shown in Table Original experimental data is shown
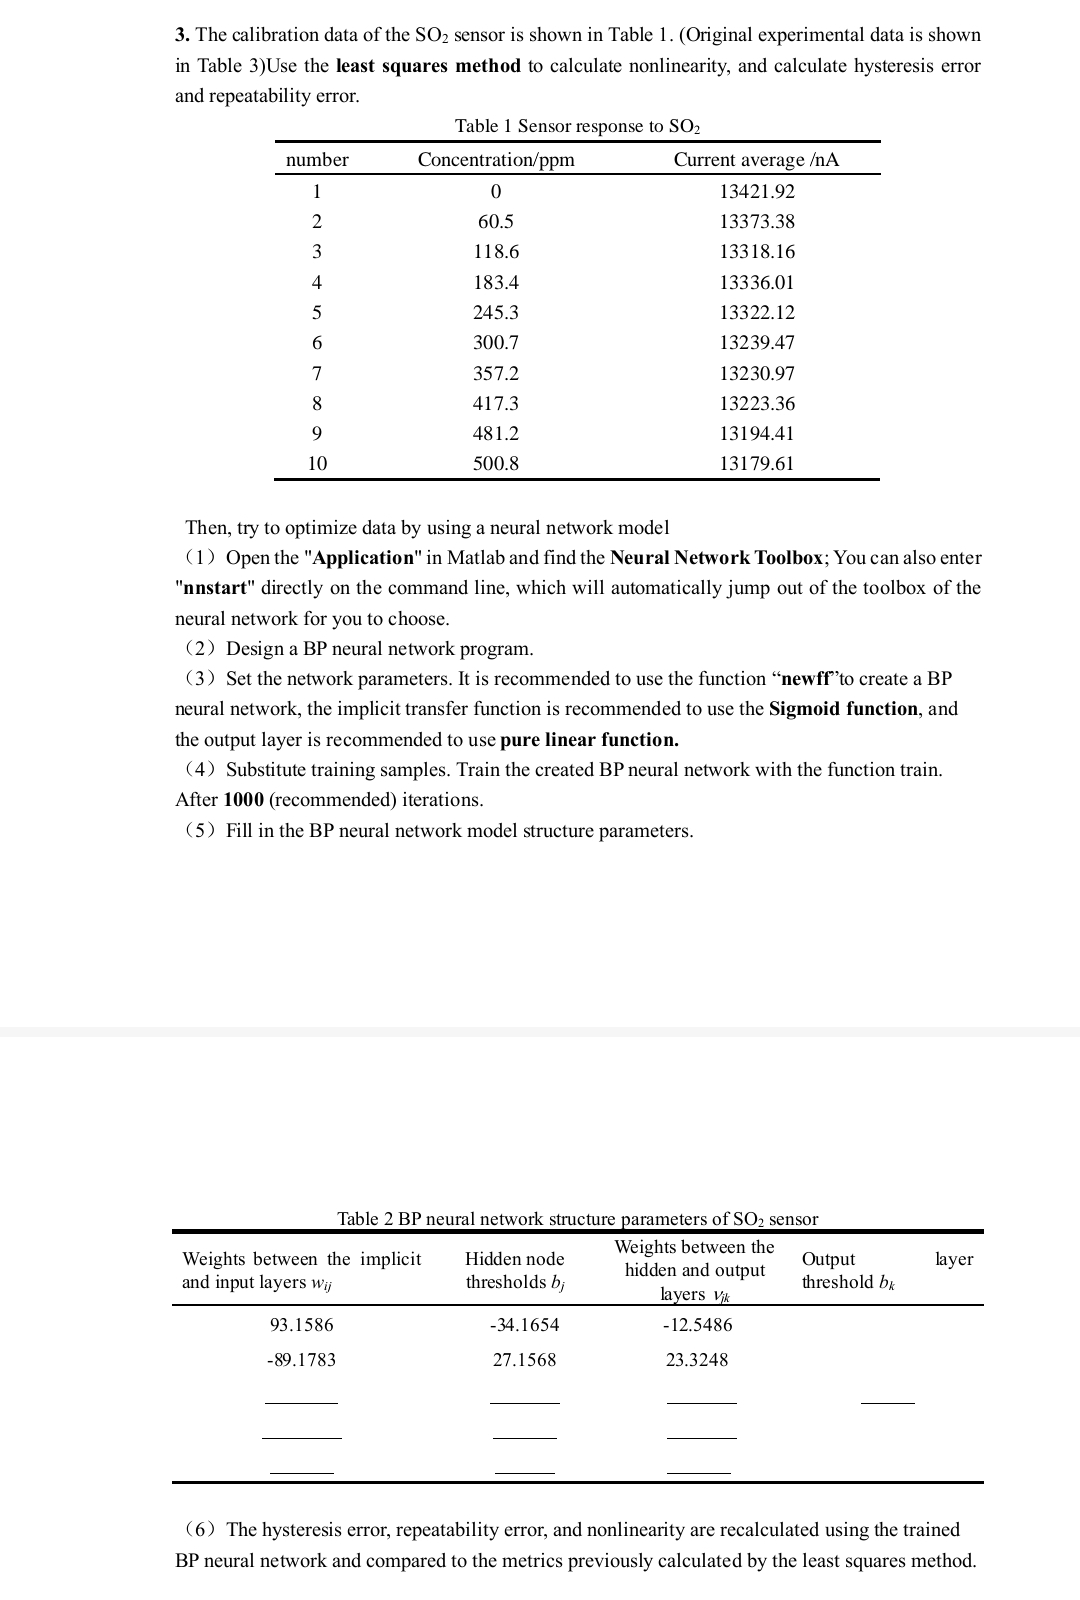
in Table Use the least squares method to calculate nonlinearity, and calculate hysteresis error
and repeatability error.
Table Sensor response to
Then, try to optimize data by using a neural network model
Open the "Application" in Matlab and find the Neural Network Toolbox; You can also enter
"nnstart" directly on the command line, which will automatically jump out of the toolbox of the
neural network for you to choose.
Design a BP neural network program.
Set the network parameters. It is recommended to use the function "newff" to create a BP
neural network, the implicit transfer function is recommended to use the Sigmoid function, and
the output layer is recommended to use pure linear function.
Substitute training samples. Train the created BP neural network with the function train.
After recommended iterations.
Fill in the BP neural network model structure parameters.
Table BP neural network structure parameters of sensor
The hysteresis error, repeatability error, and nonlinearity are recalculated using the trained
BP neural network and compared to the metrics previously calculated by the least squares method.
Step by Step Solution
There are 3 Steps involved in it
1 Expert Approved Answer
Step: 1 Unlock

Question Has Been Solved by an Expert!
Get step-by-step solutions from verified subject matter experts
Step: 2 Unlock
Step: 3 Unlock