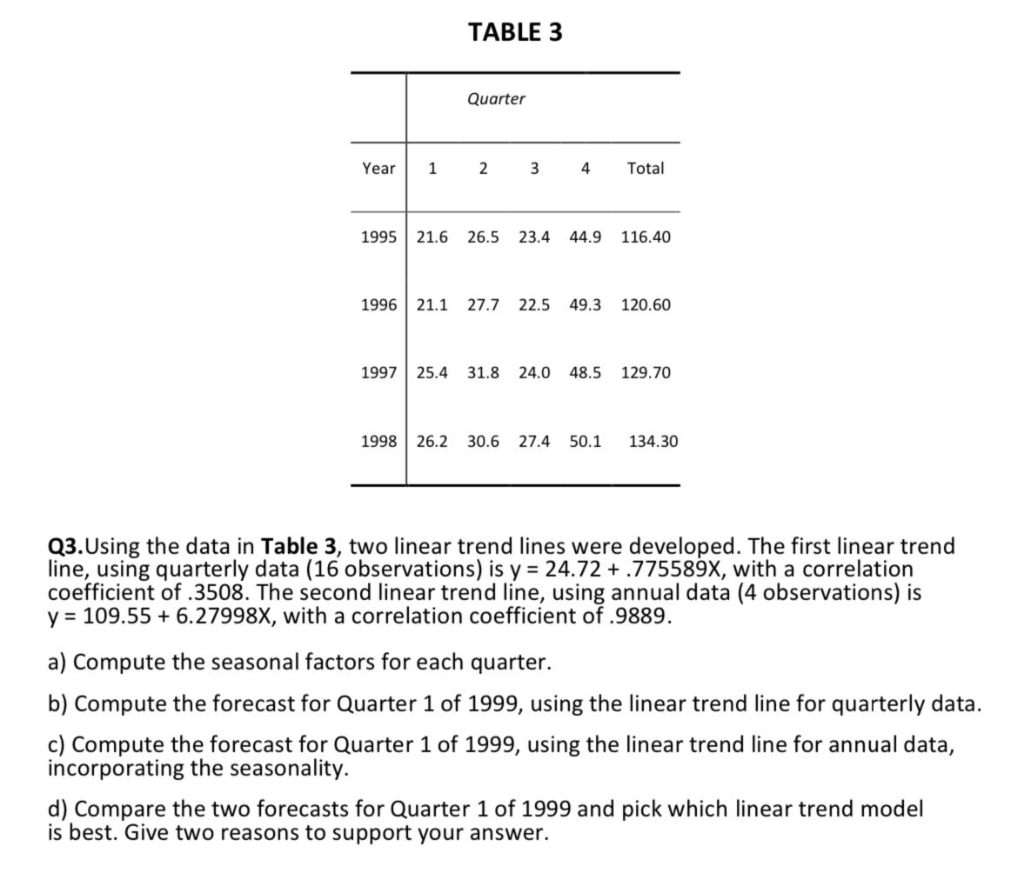
Question: TABLE 3 Quarter Year 1 2 3 4 Total 1995 21.6 26.5 23.4 44.9 116.40 1996 21.1 27.7 22.5 49.3 120.60 1997 | 25.4 31.8

TABLE 3 Quarter Year 1 2 3 4 Total 1995 21.6 26.5

TABLE 3 Quarter Year 1 2 3 4 Total 1995 21.6 26.5 23.4 44.9 116.40 1996 21.1 27.7 22.5 49.3 120.60 1997 | 25.4 31.8 24.0 48.5 129.70 1998 26.2 30.6 27.4 50.1 134.30 Q3.Using the data in Table 3, two linear trend lines were developed. The first linear trend line, using quarterly data (16 observations) is y = 24.72 + .775589x, with a correlation coefficient of .3508. The second linear trend line, using annual data (4 observations) is y = 109.55 + 6.27998X, with a correlation coefficient of .9889. a) Compute the seasonal factors for each quarter. b) Compute the forecast for Quarter 1 of 1999, using the linear trend line for quarterly data. c) Compute the forecast for Quarter 1 of 1999, using the linear trend line for annual data, incorporating the seasonality. d) Compare the two forecasts for Quarter 1 of 1999 and pick which linear trend model is best. Give two reasons to support your

Step by Step Solution

There are 3 Steps involved in it

1 Expert Approved Answer
Step: 1 Unlock blur-text-image
Question Has Been Solved by an Expert!

Get step-by-step solutions from verified subject matter experts

Step: 2 Unlock
Step: 3 Unlock

Students Have Also Explored These Related General Management Questions!