

Question: Table 3 - Ratio Analysis 2018 2019 1.33 0.28 1.44 0.32 0.84 6.26 0.82 5.49 Short-term (Liquidity) Ratios Current Ratio Cash Ratio Long-Term Solvency Ratios
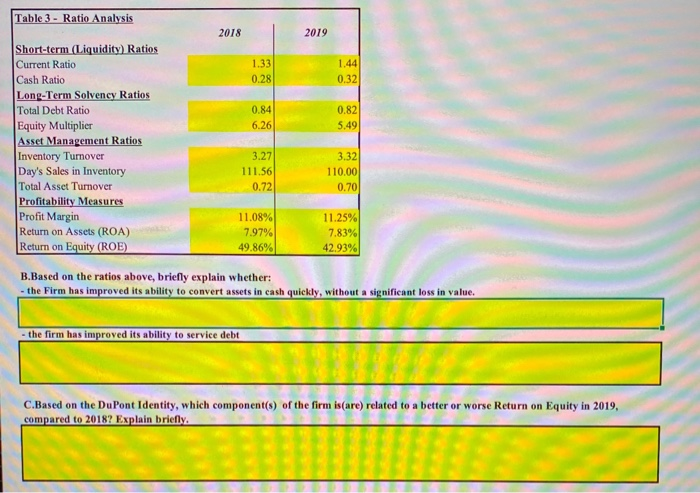
Table 3 - Ratio Analysis 2018 2019 1.33 0.28 1.44 0.32 0.84 6.26 0.82 5.49 Short-term (Liquidity) Ratios Current Ratio Cash Ratio Long-Term Solvency Ratios Total Debt Ratio Equity Multiplier Asset Management Ratios Inventory Turnover Day's Sales in Inventory Total Asset Turnover Profitability Measures Profit Margin Return on Assets (ROA) Return on Equity (ROE) 3.27 111.56 0.72 3.32 110.00 0.70 11.08% 7.97% 49.86% 11.25% 7.83% 42.93% B.Based on the ratios above, briefly explain whether: - the Firm has improved its ability to convert assets in cash quickly, without a significant loss in value. - the firm has improved its ability to service debt C. Based on the DuPont Identity, which component(s) of the firm is (are) related to a better or worse Return on Equity in 2019, compared to 2018? Explain briefly
Step by Step Solution
There are 3 Steps involved in it

Get step-by-step solutions from verified subject matter experts