

Question: Table 3.1 in the previous chapter presents financial statements for R&E Supplies for the period 2018 through 2021, and Table 3.5 presents a proforma financial
Table 3.1 in the previous chapter presents financial statements for R&E Supplies for the period 2018 through 2021, and Table 3.5 presents a proforma financial forecast for 2022. Use the information in these tables to answer the following questions.
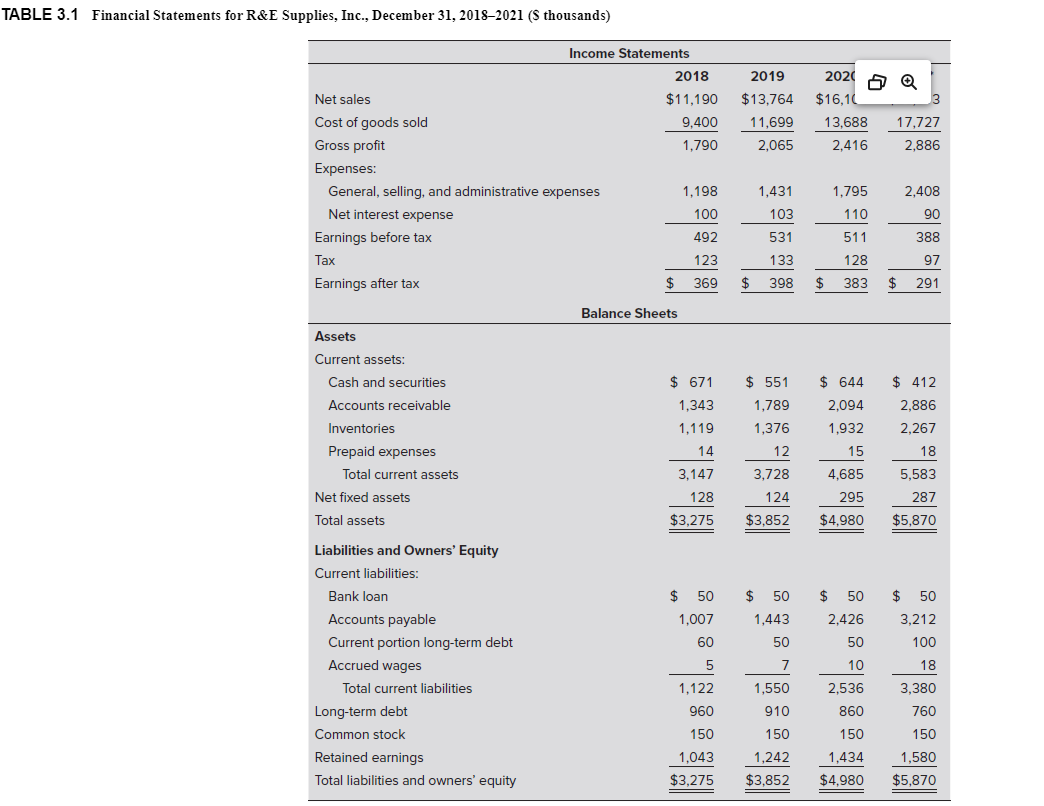
- Calculate R&Es sustainable growth rate in each year from 2019 through 2022.
- Comparing the companys sustainable growth rate with its actual and projected growth rates in sales over these years, what growth management problems does R&E appear to face in this period?
- How did the company cope with these problems? Do you see any difficulties with the way it addressed its growth problems over this period? If so, what are they?
- What advice would you offer management regarding managing future growth?
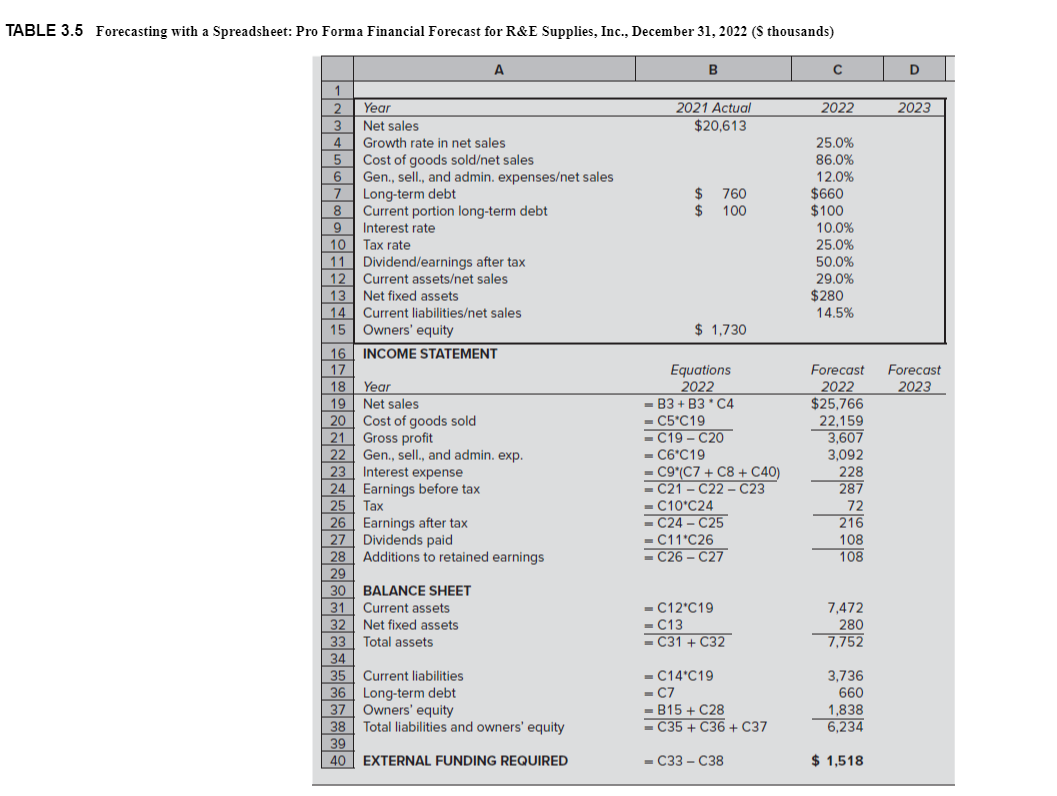
ABLE 3.1 Financial Statements for R\&E Supplies. Inc.. December 31. 2018-2021 (S thousands) TABLE 3.5 Forecasting with a Spreadsheet: Pro Forma Financial Forecast for R\&E Supplies, Inc., December 31, 2022 (\$ thousands) \begin{tabular}{|c|c|c|c|c|} \hline & A & B & C & D \\ \hline \multicolumn{5}{|l|}{1} \\ \hline 2 & Year & 2021 Actual & 2022 & 2023 \\ \hline 3 & Net sales & $20,613 & & \\ \hline 4 & Growth rate in net sales & & 25.0% & \\ \hline 5 & Cost of goods soldet sales & & 86.0% & \\ \hline 6 & Gen., sell., and admin. expenseset sales & & 12.0% & \\ \hline 7 & Long-term debt & $760 & $660 & \\ \hline 8 & Current portion long-term debt & $100 & $100 & \\ \hline 9 & Interest rate & & 10.0% & \\ \hline 10 & Tax rate & & 25.0% & \\ \hline 11 & Dividend/earnings after tax & & 50.0% & \\ \hline 12 & Current assetset sales & & 29.0% & \\ \hline 13 & Net fixed assets & & $280 & \\ \hline 14 & Current liabilitieset sales & & 14.5% & \\ \hline 15 & Owners' equity & $1,730 & & \\ \hline 16 & \multirow[t]{3}{*}{ INCOME STATEMENT } & \multirow{3}{*}{\begin{tabular}{c} Equations \\ 2022 \end{tabular}} & & \multirow{3}{*}{\begin{tabular}{c} Forecast \\ 2023 \end{tabular}} \\ \hline 17 & & & Forecast & \\ \hline 18 & & & 2022 & \\ \hline 19 & Net sales & =B3+B3C4 & $25,766 & \\ \hline 20 & Cost of goods sold & =CC19 & 22,159 & \\ \hline 21 & Gross profit & =C19C20 & 3,607 & \\ \hline 22 & Gen., sell., and admin. exp. & =C6C19 & 3,092 & \\ \hline 23 & Interest expense & =C9(C7+C8+C40) & 228 & \\ \hline 24 & Earnings before tax & =C21C22C23 & 287 & \\ \hline 25 & Tax & =C10C24 & 72 & \\ \hline 26 & Earnings after tax & =C24C25 & 216 & \\ \hline 27 & Dividends paid & =C11C26 & 108 & \\ \hline 28 & Additions to retained earnings & =C26C27 & 108 & \\ \hline 29 & & & & \\ \hline 30 & BALANCE SHEET & & & \\ \hline 31 & Current assets & =C12C19 & 7,472 & \\ \hline 32 & Net fixed assets & =C13 & 280 & \\ \hline 33 & Total assets & =C31+C32 & 7,752 & \\ \hline 34 & & & & \\ \hline 35 & Current liabilities & =C14C19 & 3,736 & \\ \hline 36 & Long-term debt & =C7 & 660 & \\ \hline 37 & Owners' equity & =B15+C28 & 1,838 & \\ \hline 38 & Total liabilities and owners' equity & =C35+C36+C37 & 6,234 & \\ \hline 39 & & & & \\ \hline 40 & EXTERNAL FUNDING REQUIRED & =C33C38 & $1,518 & \\ \hline \end{tabular}
Step by Step Solution
There are 3 Steps involved in it

Get step-by-step solutions from verified subject matter experts