

Question: Table 3.6 The Weekly Time Series Relations Between Size-institutional Ownership Portfolio Returns, Market Returns and Changes in Closed End Fund Discounts Over 1/2/81 to
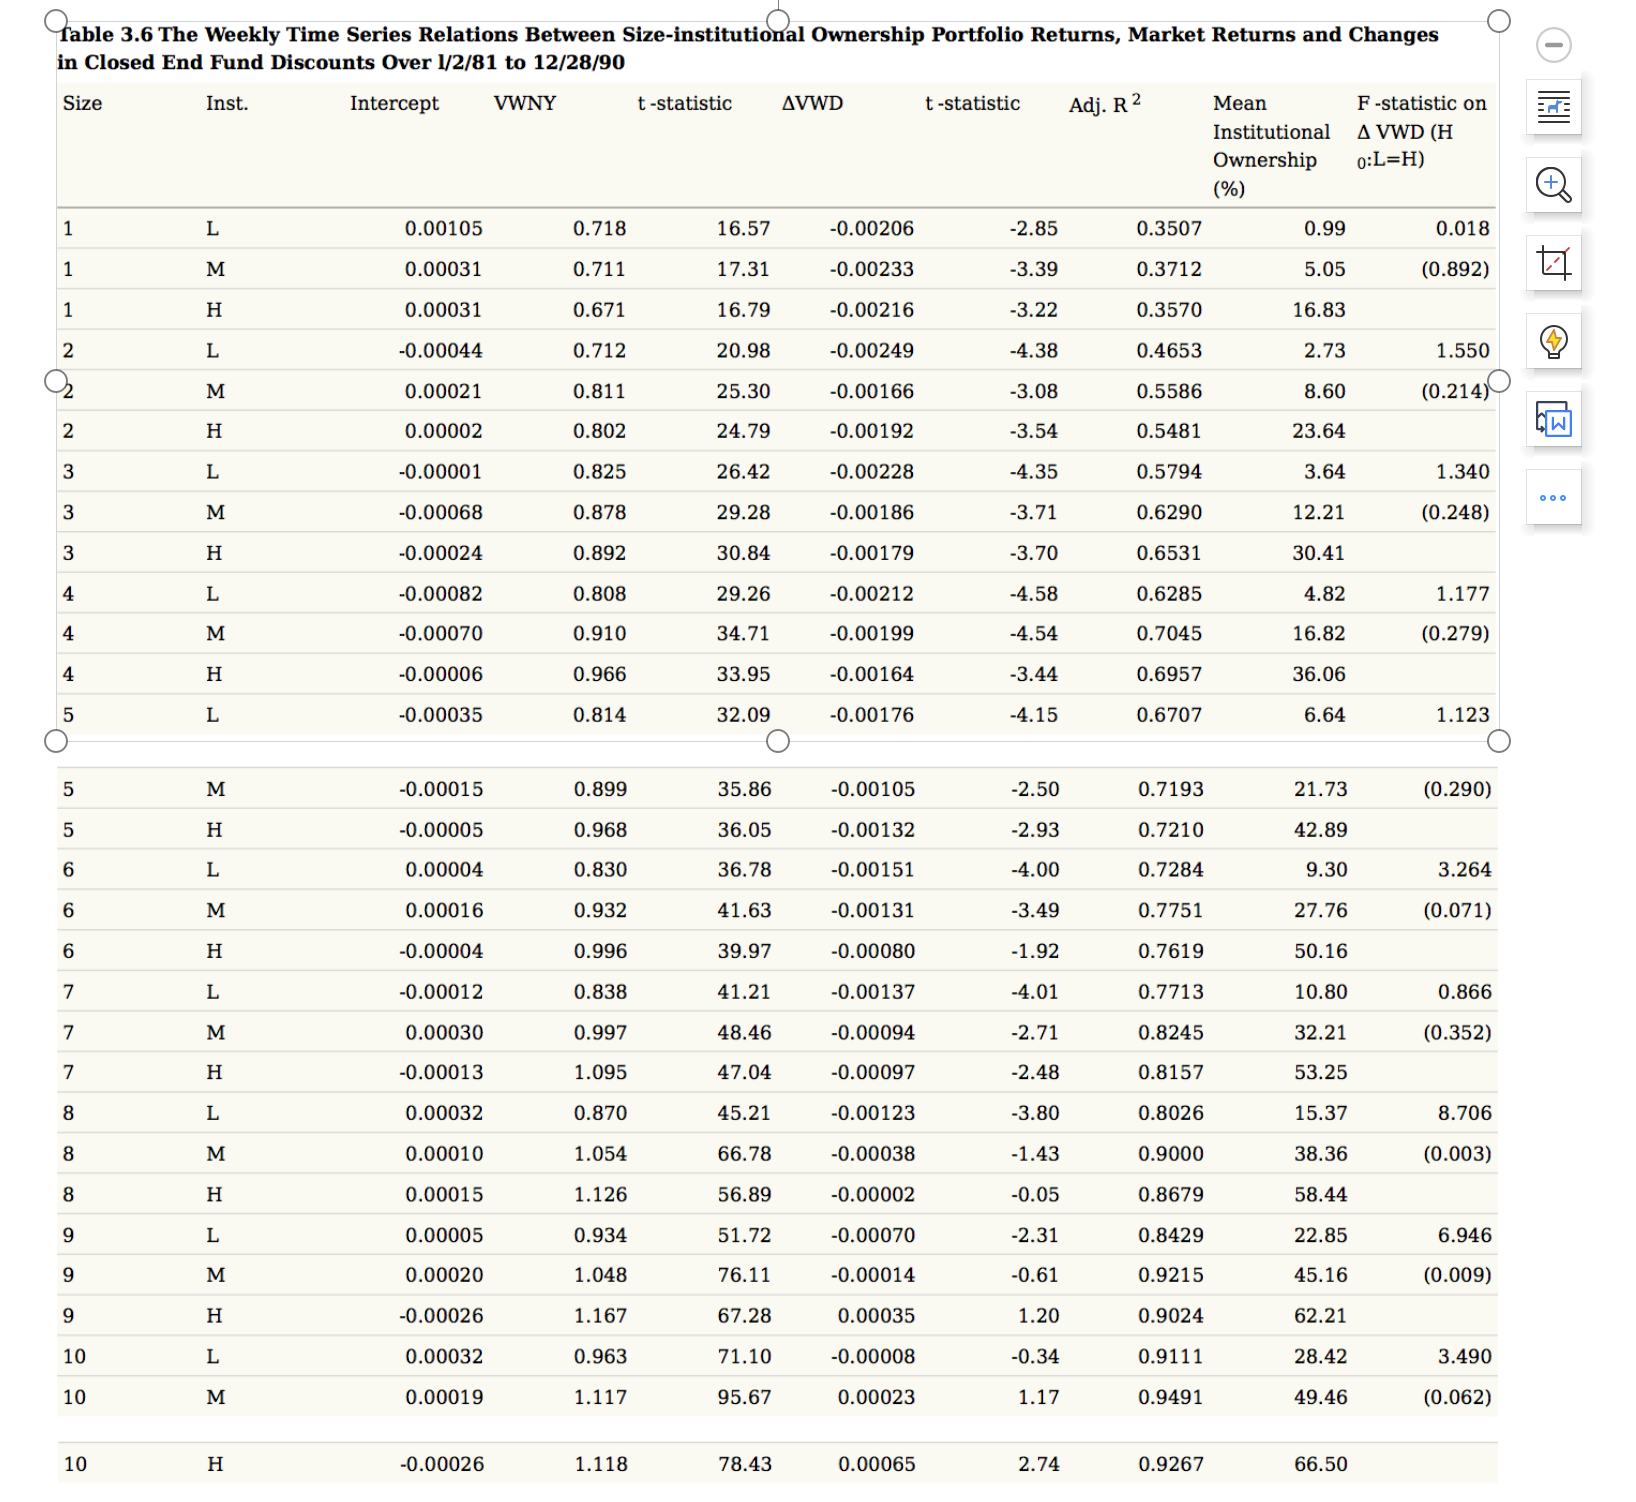
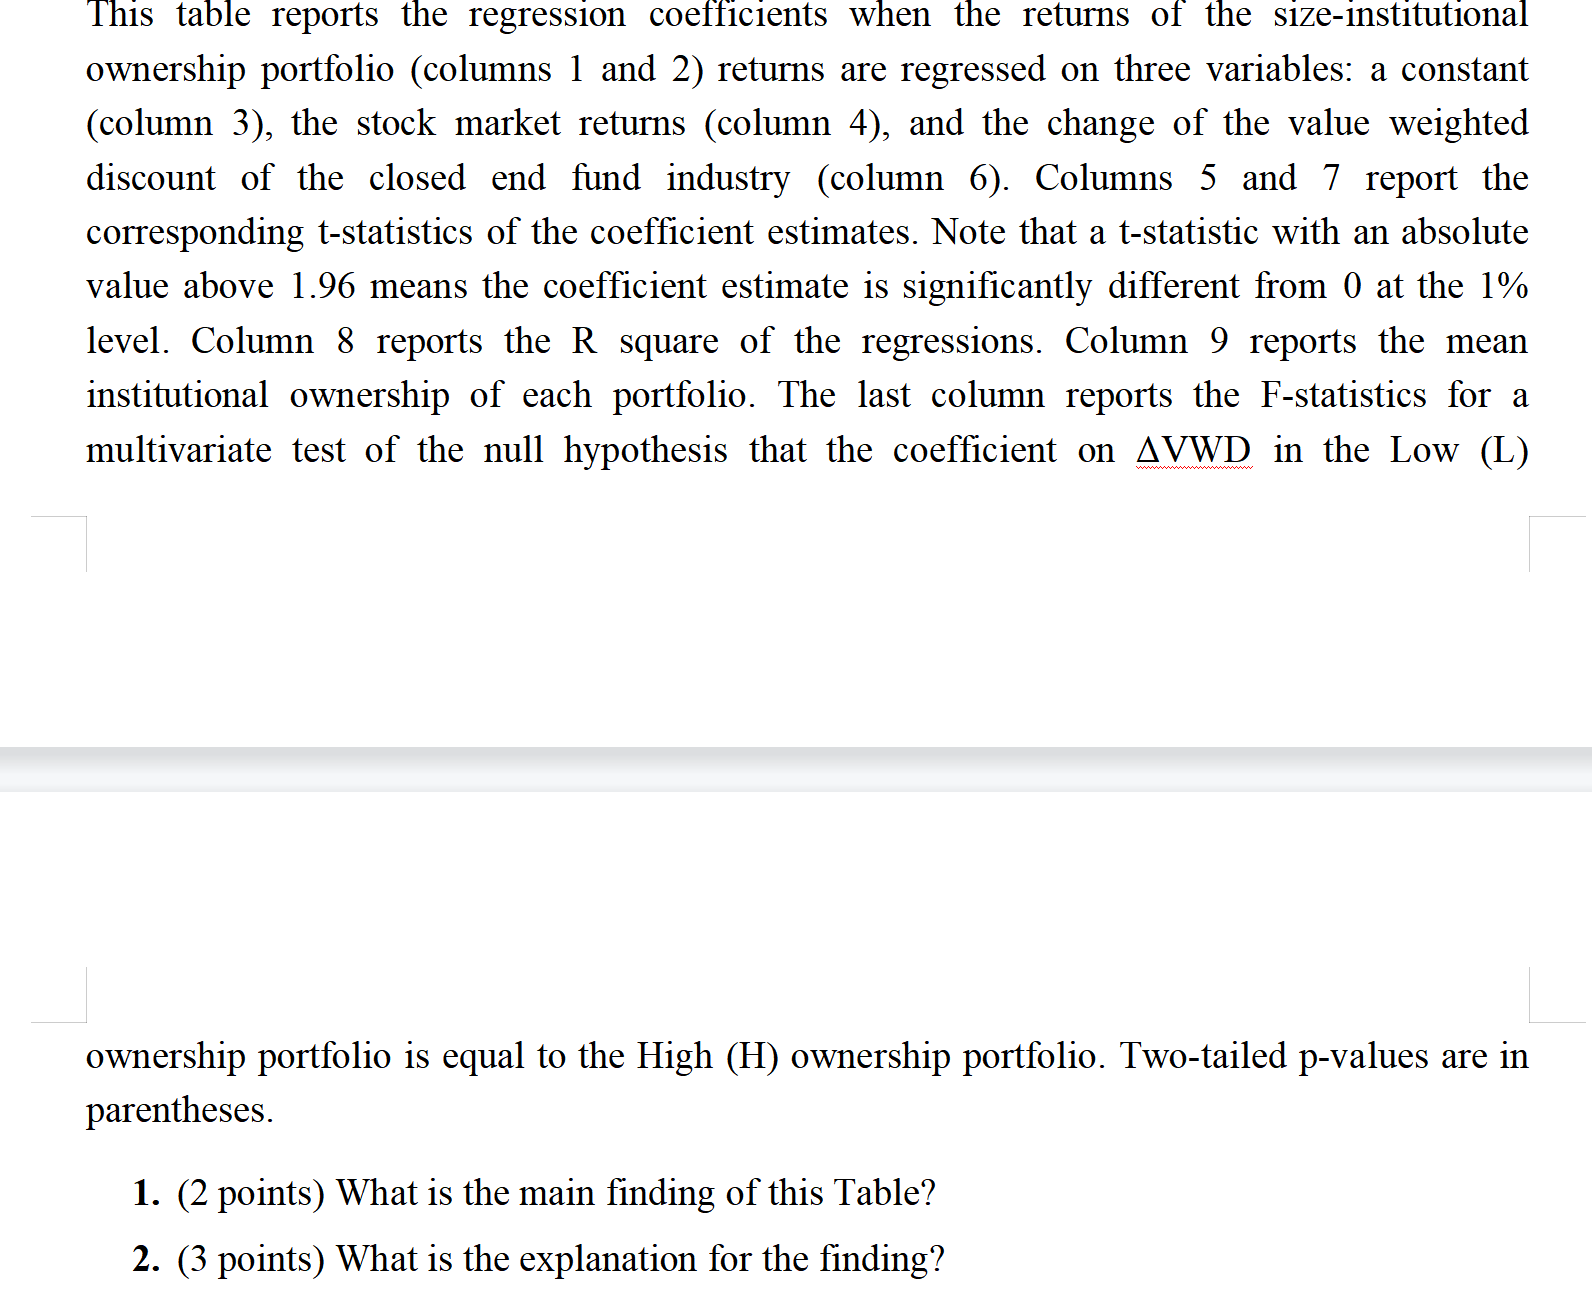
Table 3.6 The Weekly Time Series Relations Between Size-institutional Ownership Portfolio Returns, Market Returns and Changes in Closed End Fund Discounts Over 1/2/81 to 12/28/90 Size Inst. Intercept VWNY 1 1 1 2 2 3 www 3 3 4 4 4 5 5 5 6 6 6 7 7 7 8 8 8 9 9 9 10 10 10 L M H L M H L M H L M H L M H L M H L M H L M H L M H L M H 0.00105 0.00031 0.00031 -0.00044 0.00021 0.00002 -0.00001 -0.00068 -0.00024 -0.00082 -0.00070 -0.00006 -0.00035 -0.00015 -0.00005 0.00004 0.00016 -0.00004 -0.00012 0.00030 -0.00013 0.00032 0.00010 0.00015 0.00005 0.00020 -0.00026 0.00032 0.00019 -0.00026 0.718 0.711 0.671 0.712 0.811 0.802 0.825 0.878 0.892 0.808 0.910 0.966 0.814 0.899 0.968 0.830 0.932 0.996 0.838 0.997 1.095 0.870 1.054 1.126 0.934 1.048 1.167 0.963 1.117 1.118 t-statistic 16.57 17.31 16.79 20.98 25.30 24.79 26.42 29.28 30.84 29.26 34.71 33.95 32.09 35.86 36.05 36.78 41.63 39.97 41.21 48.46 47.04 45.21 66.78 56.89 51.72 76.11 67.28 71.10 95.67 78.43 AVWD -0.00206 -0.00233 -0.00216 -0.00249 -0.00166 -0.00192 -0.00228 -0.00186 -0.00179 -0.00212 -0.00199 -0.00164 -0.00176 -0.00105 -0.00132 -0.00151 -0.00131 -0.00080 -0.00137 -0.00094 -0.00097 -0.00123 -0.00038 -0.00002 -0.00070 -0.00014 0.00035 -0.00008 0.00023 0.00065 t-statistic -2.85 -3.39 -3.22 -4.38 -3.08 -3.54 -4.35 -3.71 -3.70 -4.58 -4.54 -3.44 -4.15 -2.50 -2.93 -4.00 -3.49 -1.92 -4.01 -2.71 -2.48 -3.80 -1.43 -0.05 -2.31 -0.61 1.20 -0.34 1.17 2.74 Adj. R 2 0.3507 0.3712 0.3570 0.4653 0.5586 0.5481 0.5794 0.6290 0.6531 0.6285 0.7045 0.6957 0.6707 0.7193 0.7210 0.7284 0.7751 0.7619 0.7713 0.8245 0.8157 0.8026 0.9000 0.8679 0.8429 0.9215 0.9024 0.9111 0.9491 0.9267 Mean Institutional Ownership (%) 0.99 5.05 16.83 2.73 8.60 23.64 3.64 12.21 30.41 4.82 16.82 36.06 6.64 21.73 42.89 9.30 27.76 50.16 10.80 32.21 53.25 15.37 38.36 58.44 22.85 45.16 62.21 28.42 49.46 66.50 F-statistic on A VWD (H 0:L=H) 0.018 (0.892) 1.550 (0.214) 1.340 (0.248) 1.177 (0.279) 1.123 (0.290) 3.264 (0.071) 0.866 (0.352) 8.706 (0.003) 6.946 (0.009) 3.490 (0.062) + 13 000 This table reports the regression coefficients when the returns of the size-institutional ownership portfolio (columns 1 and 2) returns are regressed on three variables: a constant (column 3), the stock market returns (column 4), and the change of the value weighted discount of the closed end fund industry (column 6). Columns 5 and 7 report the corresponding t-statistics of the coefficient estimates. Note that a t-statistic with an absolute value above 1.96 means the coefficient estimate is significantly different from 0 at the 1% level. Column 8 reports the R square of the regressions. Column 9 reports the mean institutional ownership of each portfolio. The last column reports the F-statistics for a multivariate test of the null hypothesis that the coefficient on AVWD in the Low (L) ownership portfolio is equal to the High (H) ownership portfolio. Two-tailed p-values are in parentheses. 1. (2 points) What is the main finding of this Table? 2. (3 points) What is the explanation for the finding?
Step by Step Solution
There are 3 Steps involved in it
The main finding of this table is that the change in the value weighted discount of the closedend fu... View full answer

Get step-by-step solutions from verified subject matter experts