

Question: This table reports the regression coefficients when the returns of the size-institutional ownership portfolio (columns 1 and 2) returns are regressed on three variables: a
This table reports the regression coefficients when the returns of the size-institutional ownership portfolio (columns 1 and 2) returns are regressed on three variables: a constant (column 3), the stock market returns (column 4), and the change of the value-weighted discount of the closed-end fund industry (column 6). Columns 5 and 7 report the corresponding t-statistics of the coefficient estimates. Note that a t-statistic with an absolute value above 1.96 means the coefficient estimate is significantly different from 0 at the 1% level. Column 8 reports the R square of the regressions. Column 9 reports the mean institutional ownership of each portfolio. The last column reports the F-statistics for a multivariate test of the null hypothesis that the coefficient on VWD in the Low (L) ownership portfolio is equal to the High (H) ownership portfolio. Two-tailed p-values are in parentheses.
1) What is the main finding of this Table?
2) What is the explanation for the finding? 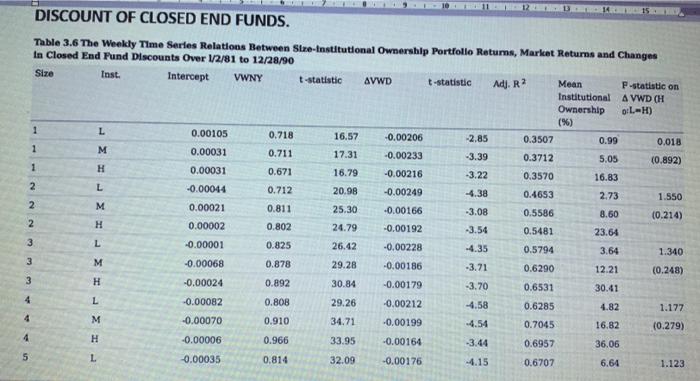
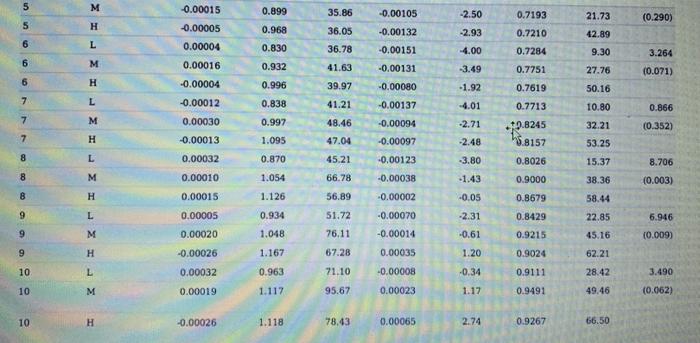
Table 3.6 The Weekly Time Series Relatlons Between Stre-Institutlonal Ownership Portfollo Returns, Market Returns and Changes In Closed End Fund Discounts Over 1/2/81 to 12/28/90 Table 3.6 The Weekly Time Series Relatlons Between Stre-Institutlonal Ownership Portfollo Returns, Market Returns and Changes In Closed End Fund Discounts Over 1/2/81 to 12/28/90
Step by Step Solution
There are 3 Steps involved in it

Get step-by-step solutions from verified subject matter experts