

Question: TABLE (5) A Symbol Open High Low Close Val Net %Chg Chg -0.15 -0.66 AIR 23.15 22.50 22.72 AAN 22.86 23.21 22.55 22.70 -0.14 -0.61
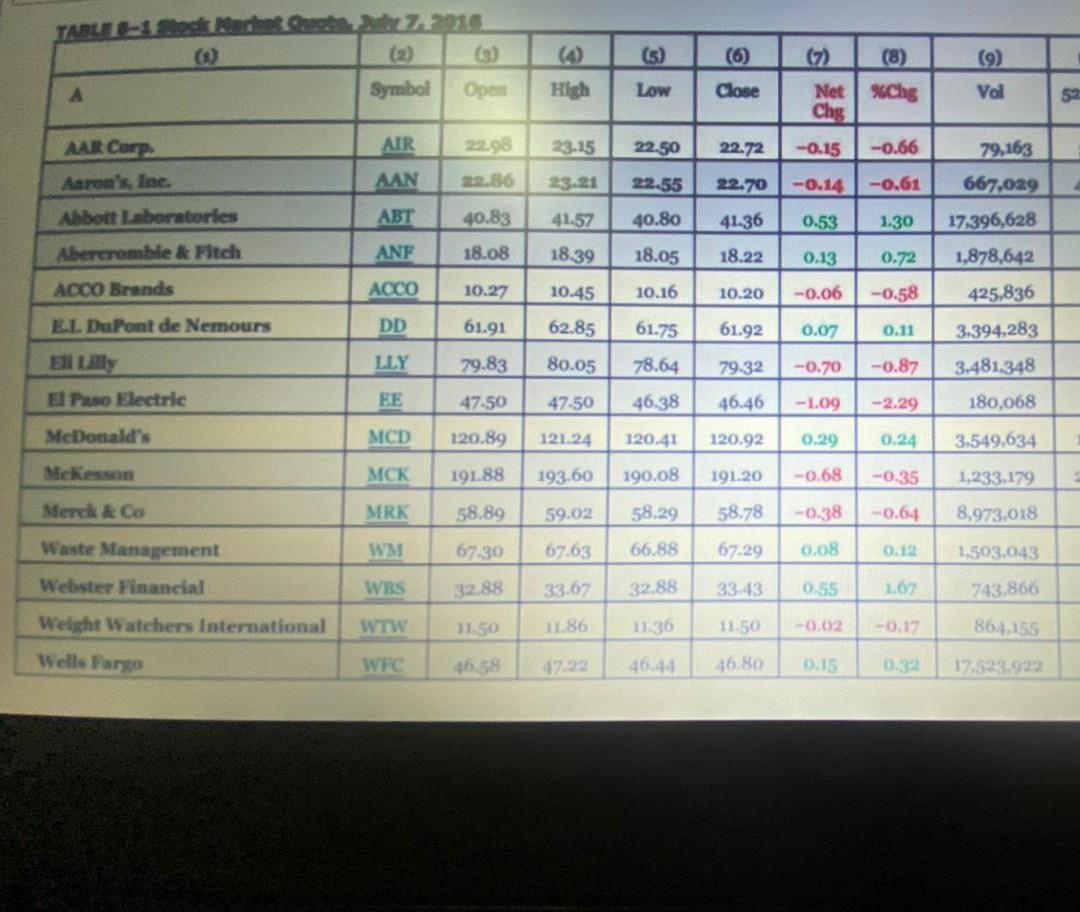
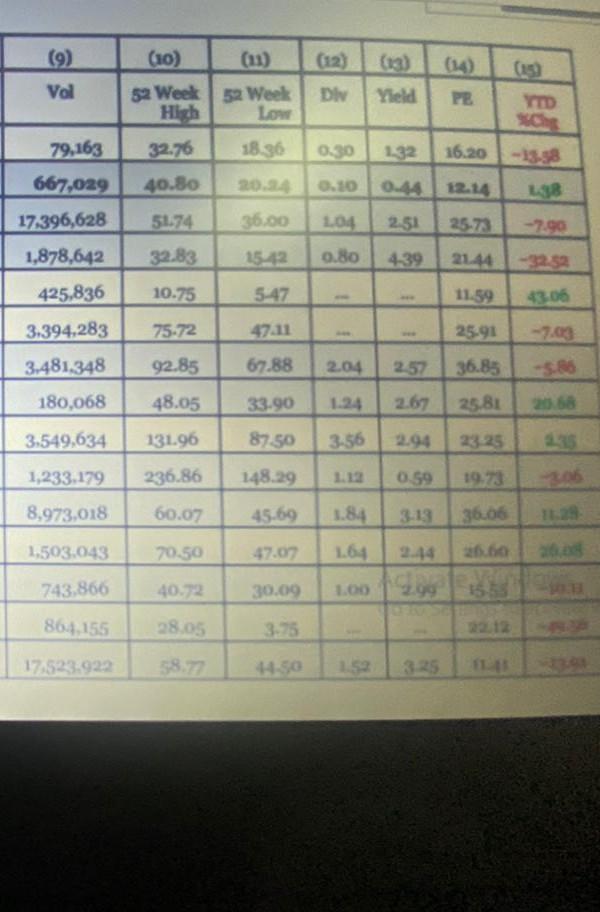
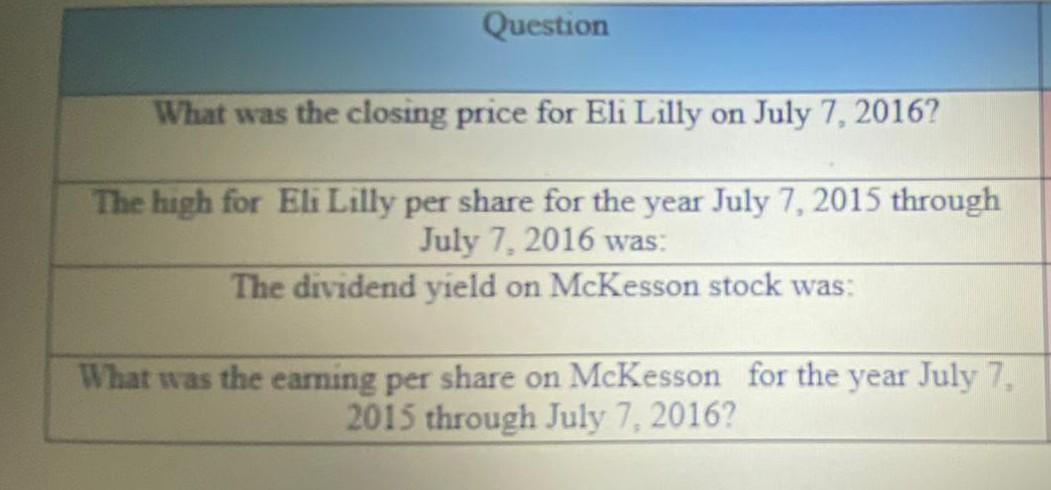
TABLE (5) A Symbol Open High Low Close Val Net %Chg Chg -0.15 -0.66 AIR 23.15 22.50 22.72 AAN 22.86 23.21 22.55 22.70 -0.14 -0.61 AAR Corp Aaron's Ine. Abbott Laboratories Abercrombie & Fitch ACCO Brands 79,163 667,029 17.396,628 ABT 40.83 41.57 40.80 41.36 0.53 1.30 ANF 18.08 18.39 18.05 18.22 0.13 0.72 1,878,642 ACCO 10.27 10.45 10.16 10.20 -0.06 -0.58 425,836 EL DuPont de Nemours DD 61.91 62.85 61.75 61.92 0.07 0.11 3,394,283 El Lay LLY 79.83 80.05 78.64 79.32 -0.70 -0.87 3,481,348 El Paso Electric EE 47.50 47.50 46.38 46.46 -1.09 -2.29 180,068 MeDonald's MCD 120.89 121.24 120.92 0.29 0.24 3,549,634 120.41 190.08 Mekeson MCK 191.88 193.60 191.20 -0.68 -0.35 1,233.179 Merck & Co MRK 58.89 59.02 58.78 -0.38 -0.64 8,973.018 58.29 66.88 Waste Management WM 67.30 67.63 67.29 0.08 0.12 1.503.043 Webster Financial WBS 32.88 33.67 32.88 3343 0.55 1.6 743,866 Weight Watchers International WTW 11.50 11.86 11:36 11:50 -0.12 864.155 Wells Fargo WFC 4722 46.44 46.80 0.15 032 17.523.92 (12) (199 Val Div Yield PE (10) (11) 52 Week 52 Week High Low 32.76 1836 40.80 WD sche 0.30 132 16.20 0.10 0.4412.14 79,163 667,029 17.396,628 1,878,642 425,836 51.74 36.00 104 2.51 25-73 -7.90 32.83 15.12 0.80 4.39 21.44 10.75 547 11.59 4306 3.394,283 75-72 47.11 1 1 25.91 3.481348 92.85 67.88 2.04 36.85 180,068 48.05 33.90 1.24 2.67 25.81 3,549,634 131.96 87.50 3.56 23:25 1,233.179 236.86 148.29 0.59 19.73 8,973,018 60.07 45.69 1.84 36.00 1.503.043 70.50 47.07 1.64 6.60 1.00299 15 743,866 40.72 30.09 864.155 28.05 17.523.923 58.7 325 Question What was the closing price for Eli Lilly on July 7, 2016? The high for Eli Lilly per share for the year July 7, 2015 through July 7, 2016 was The dividend yield on McKesson stock was: What was the earning per share on McKesson for the year July 7, 2015 through July 7, 2016
Step by Step Solution
There are 3 Steps involved in it

Get step-by-step solutions from verified subject matter experts