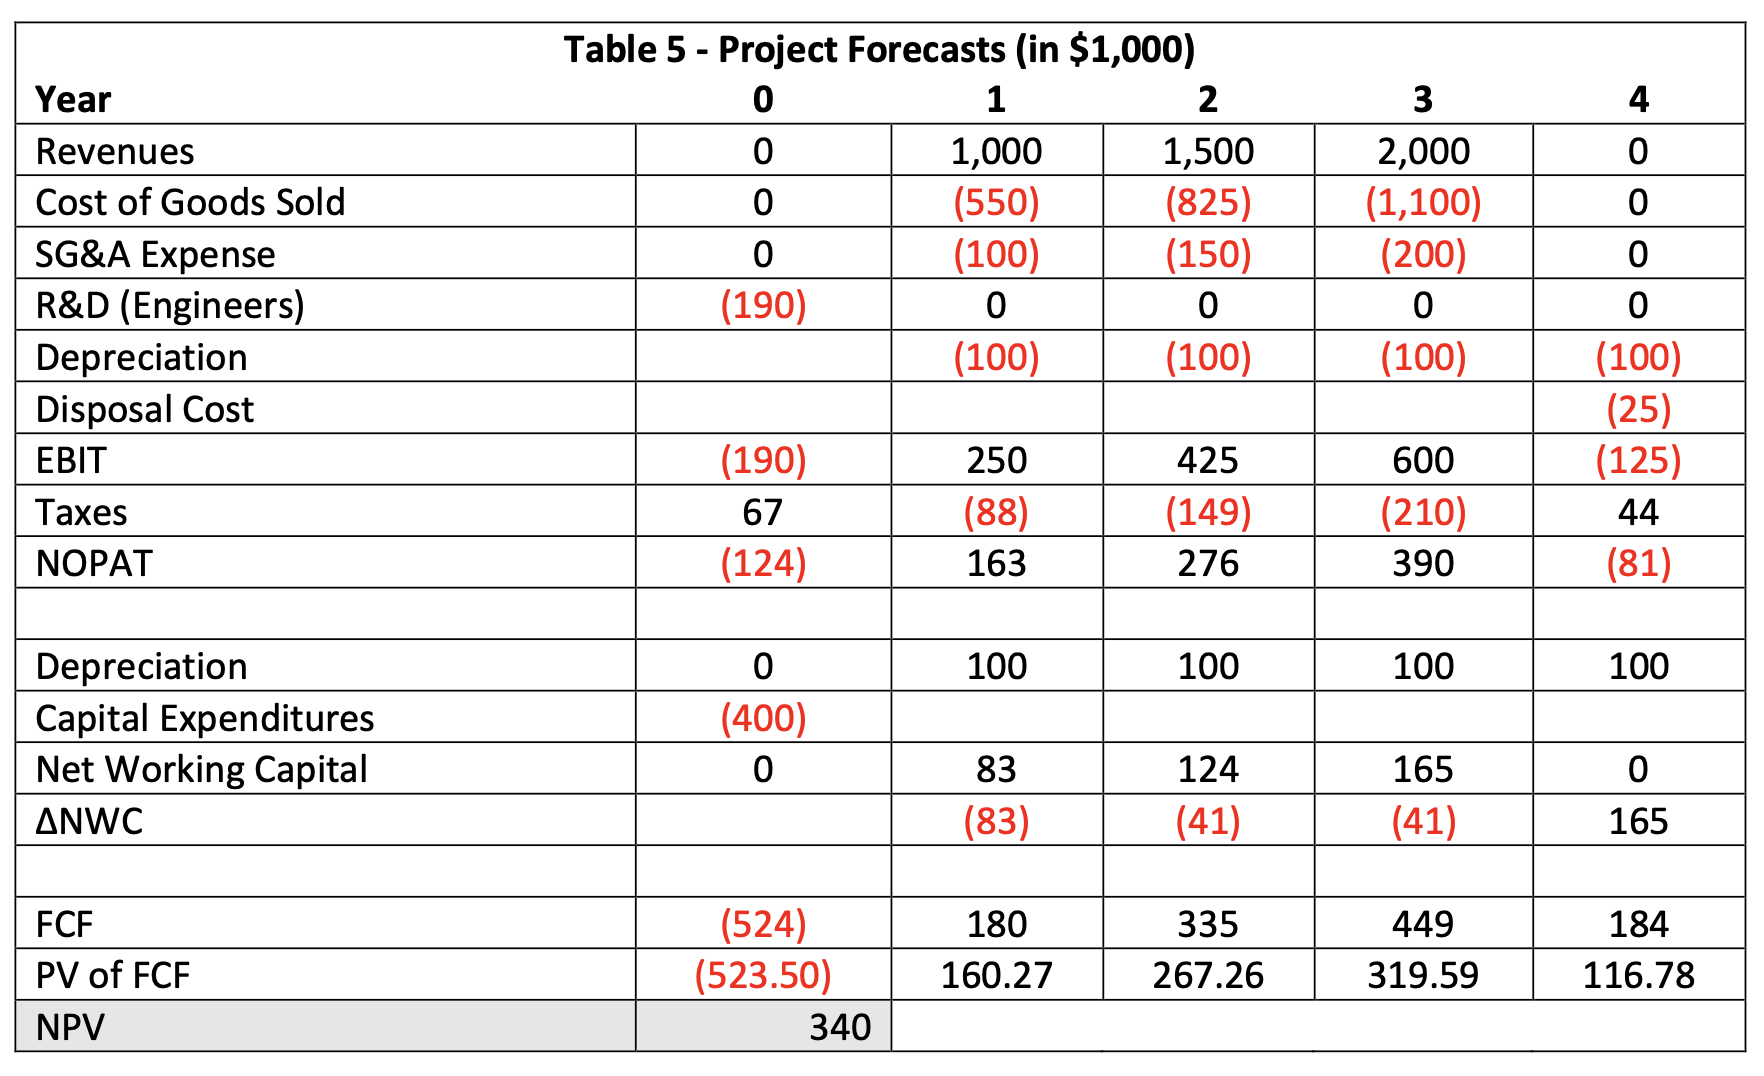
Question: Table 5 - Project Forecasts (in $1,000) Year 0 1 2 3 Revenues 0 1,000 OP 1,500 2,000 Cost of Goods Sold 0 (550) (825)

Table 5 - Project Forecasts (in $1,000) Year 0 1
Table 5 - Project Forecasts (in $1,000) Year 0 1 2 3 Revenues 0 1,000 OP 1,500 2,000 Cost of Goods Sold 0 (550) (825) (1,100) O SG&A Expense (100) (150) (200) O R&D (Engineers) (190) 0 0 0 0 Depreciation (100) (100) (100) Disposal Cost (100) (25) EBIT (190) 250 425 600 (125) Taxes 67 (88) (149) (210) 44 NOPAT (124) 163 276 390 (81) Depreciation 0 100 100 100 100 Capital Expenditures (400) Net Working Capital 0 83 124 165 0 ANWC (83) (41) (41) 165 FCF (524) 180 335 449 184 PV of FCF (523.50) 160.27 267.26 319.59 116.78 NPV 340

Step by Step Solution

There are 3 Steps involved in it

1 Expert Approved Answer
Step: 1 Unlock blur-text-image
Question Has Been Solved by an Expert!

Get step-by-step solutions from verified subject matter experts

Step: 2 Unlock
Step: 3 Unlock

Students Have Also Explored These Related Finance Questions!