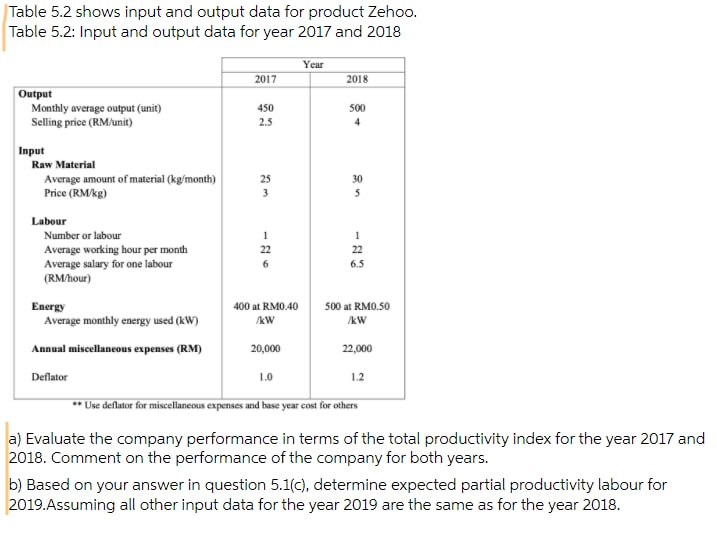
Question: Table 5.2 shows input and output data for product Zehoo. Table 5.2: Input and output data for year 2017 and 2018 Year 2017 2018 Output

Table 5.2 shows input and output data for product

Table 5.2 shows input and output data for product Zehoo. Table 5.2: Input and output data for year 2017 and 2018 Year 2017 2018 Output Monthly average output (unit) Selling price (RM/unit) 450 25 500 4 25 3 30 5 Input Raw Material Average amount of material (kg/month) Price (RM/kg) Labour Number or labour Average working hour per month Average salary for one labour (RM/hour) Energy Average monthly energy used (kW) Annual miscellaneous expenses (RM) Deflator 1 22 6 1 22 6.5 400 at RM0.40 500 at RM0.50 /kW AW 20,000 22,000 1.0 1.2 ** Use deflator for miscellaneous expenses and bese year cost for others a) Evaluate the company performance in terms of the total productivity index for the year 2017 and 2018. Comment on the performance of the company for both years. b) Based on your answer in question 5.1(c), determine expected partial productivity labour for 2019. Assuming all other input data for the year 2019 are the same as for the year 2018

Step by Step Solution

There are 3 Steps involved in it

1 Expert Approved Answer
Step: 1 Unlock blur-text-image
Question Has Been Solved by an Expert!

Get step-by-step solutions from verified subject matter experts

Step: 2 Unlock
Step: 3 Unlock

Students Have Also Explored These Related General Management Questions!