

Question: Table 6.15 Data for Exercise 6.8 on Surgery and Sore Throats Patient D T Y Patient D Y Patient D SEODX 40 VAWN- 45 13
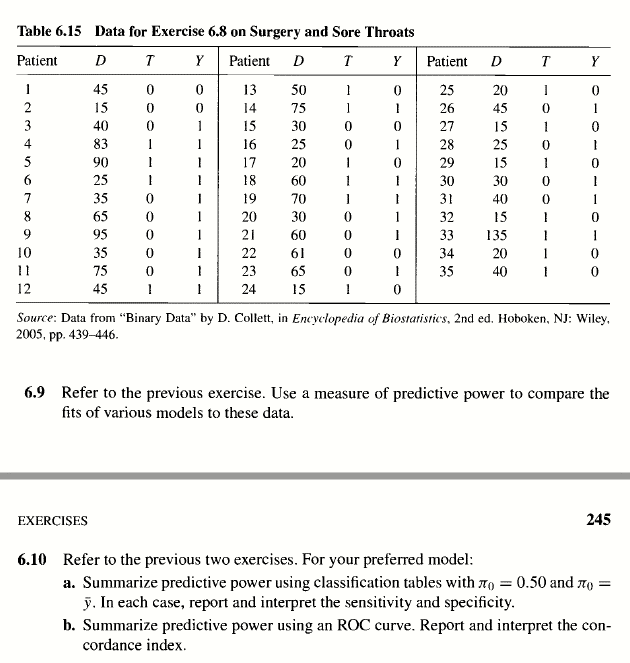
Table 6.15 Data for Exercise 6.8 on Surgery and Sore Throats Patient D T Y Patient D Y Patient D SEODX 40 VAWN- 45 13 50 25 20 15 14 75 26 45 40 15 30 27 15 83 16 25 O -O 28 25 90 17 20 29 15 25 90 090 - 18 60 30 9- 0-0 35 70 40 65 20 30 15 95 60 9090 - 135 35 22 61 20 75 23 65 35 40 45 24 15 Source: Data from "Binary Data" by D. Collett, in Encyclopedia of Biostatistics, 2nd ed. Hoboken, NJ: Wiley, 2005, pp. 439-446. 6.9 Refer to the previous exercise. Use a measure of predictive power to compare the fits of various models to these data. 245 EXERCISES 6.10 Refer to the previous two exercises. For your preferred model: a. Summarize predictive power using classification tables with no = 0.50 and no = y. In each case, report and interpret the sensitivity and specificity. b. Summarize predictive power using an ROC curve. Report and interpret the con- cordance index
Step by Step Solution
There are 3 Steps involved in it

Get step-by-step solutions from verified subject matter experts