

Question: Table 7-11 Price Quantity Demanded Quantity Supplied (Dollars per unit) (Units) (Units) 12.00 36 10.00 3 30 8.00 6 24 6.00 g 18 4.00 12

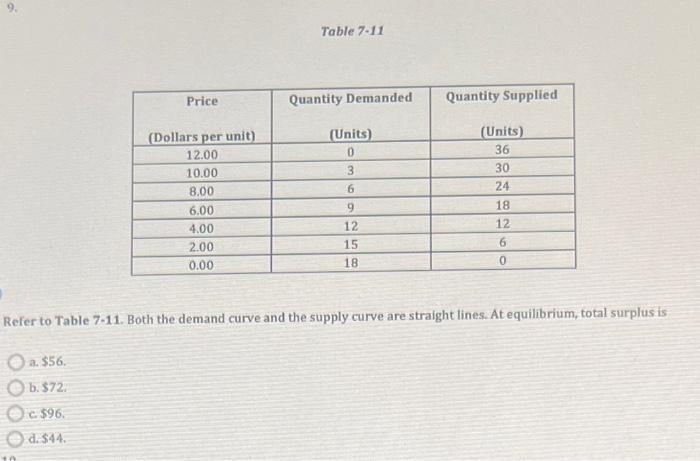
Table 7-11 Price Quantity Demanded Quantity Supplied (Dollars per unit) (Units) (Units) 12.00 36 10.00 3 30 8.00 6 24 6.00 g 18 4.00 12 12 2.00 15 6 0.00 18 0 Refer to Table 7-11. Both the demand curve and the supply curve are straight lines. At equilibrium, total surplus is Oa $56. O b. $72 O c. $96 O d. $44
Step by Step Solution
There are 3 Steps involved in it
1 Expert Approved Answer
Step: 1 Unlock

Question Has Been Solved by an Expert!
Get step-by-step solutions from verified subject matter experts
Step: 2 Unlock
Step: 3 Unlock