

Question: Table 7.8 in Chapter 7 shows data from the Substance2 data file at the text website. use logistic regression to analyze these data, treating marijuana
Table 7.8 in Chapter 7 shows data from the Substance2 data file at the text website. use logistic regression to analyze these data, treating marijuana use as the response variable and alcohol use, cigarette use, gender, and race as explanatory variables. Please give me a short report summarizing model- based descriptive and inferential results.
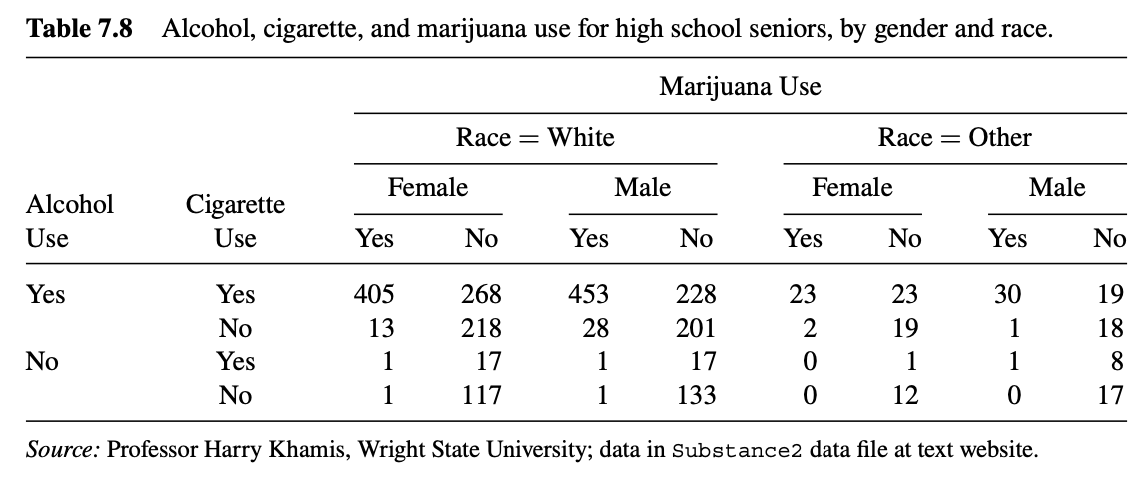
Table 7.8 Alcohol, cigarette, and marijuana use for high school seniors, by gender and race. Marijuana Use Race = White Race = Other Female Male Female Alcohol Male Cigarette Use Use Yes No Yes No Yes No Yes No Yes Yes 405 268 453 228 23 23 30 19 No 13 218 28 201 2 19 18 No Yes 1 17 17 0 1 8 No 117 133 12 17 Source: Professor Harry Khamis, Wright State University; data in Substance2 data file at text website
Step by Step Solution
There are 3 Steps involved in it

Get step-by-step solutions from verified subject matter experts