

Question: (a) Make a line graph of the U.S. civilian labor force data. Line Graph A Line Graph B US Civilian Labor Force (2007-2016) US
![]()
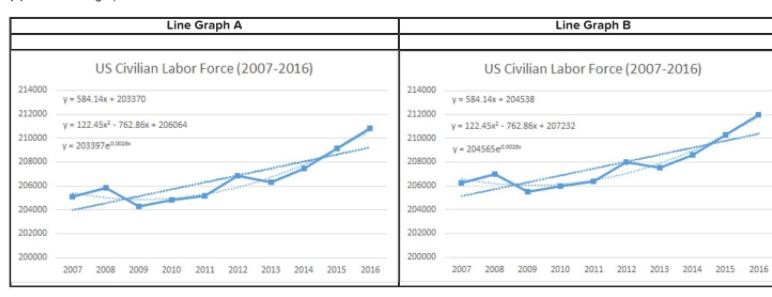
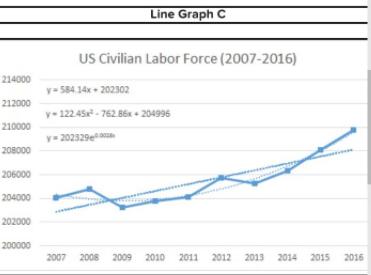
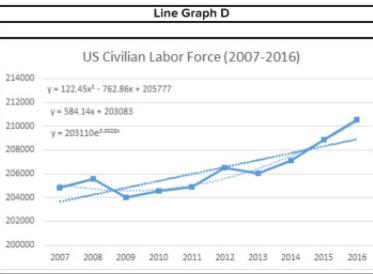
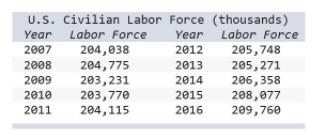
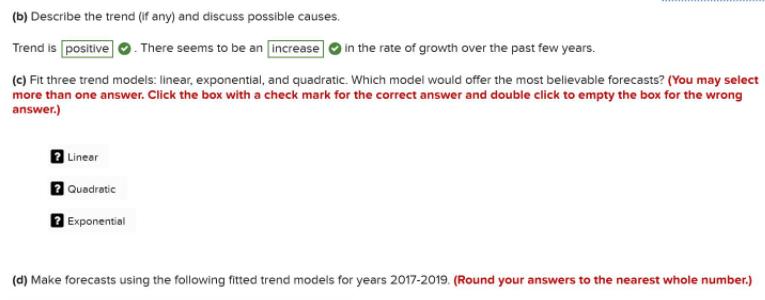
(a) Make a line graph of the U.S. civilian labor force data. Line Graph A Line Graph B US Civilian Labor Force (2007-2016) US Civilian Labor Force (2007-2016) 214000 214000 y- 584.14x+ 203370 y= S84.14x+ 204538 212000 212000 y- 122.45 - 762.85K + 206064 y-122.45x - 762.86x + 207232 210000 210000 y-203397e y- 204565ea 208000 208000 206000 206000 204000 204000 202000 202000 200000 200000 2007 2008 2009 2010 2011 2012 2013 2014 2015 2016 2007 2008 2009 2010 2011 2012 2013 2014 2015 2016 Line Graph C US Civilian Labor Force (2007-2016) 214000 v- 584.14x + 202302 212000 v-12245 - 762.86x + 204996 210000 y- 202329e 208000 206000 204000 202000 200000 2007 2008 2009 2010 2011 2012 2013 2014 2015 2016 Line Graph D US Civilian Labor Force (2007-2016) 214000 y- 122.45 - 762.86 205777 212000 v- 584.14 - 203083 210000 y- 203110e 208000 206000 204000 202000 200000 2007 2008 2009 2010 2011 2012 2013 2014 2015 2016 U.S. Civilian Labor Force (thousands) Year Labor Force Year Labor Force 2007 204,038 204,775 203,231 203,770 204,115 2012 205,748 2008 2013 205,271 206, 358 208,077 209,760 2009 2014 2010 2015 2011 2016 (b) Describe the trend (if any) and discuss possible causes. Trend is positive There seems to be an increase in the rate of growth over the past few years. (c) Fit three trend models: linear, exponential, and quadratic. Which model would offer the most believable forecasts? (You may select more than one answer. Click the box with a check mark for the correct answer and double click to empty the box for the wrong answer.) Linear Quadratic 2 Exponential (d) Make forecasts using the following fitted trend models for years 2017-2019. (Round your answers to the nearest whole number.)
Step by Step Solution
3.44 Rating (147 Votes )
There are 3 Steps involved in it
To create a line graph of the US civilian labor force data you should use the table provided and plot the data points for each year Heres how to inter... View full answer

Get step-by-step solutions from verified subject matter experts