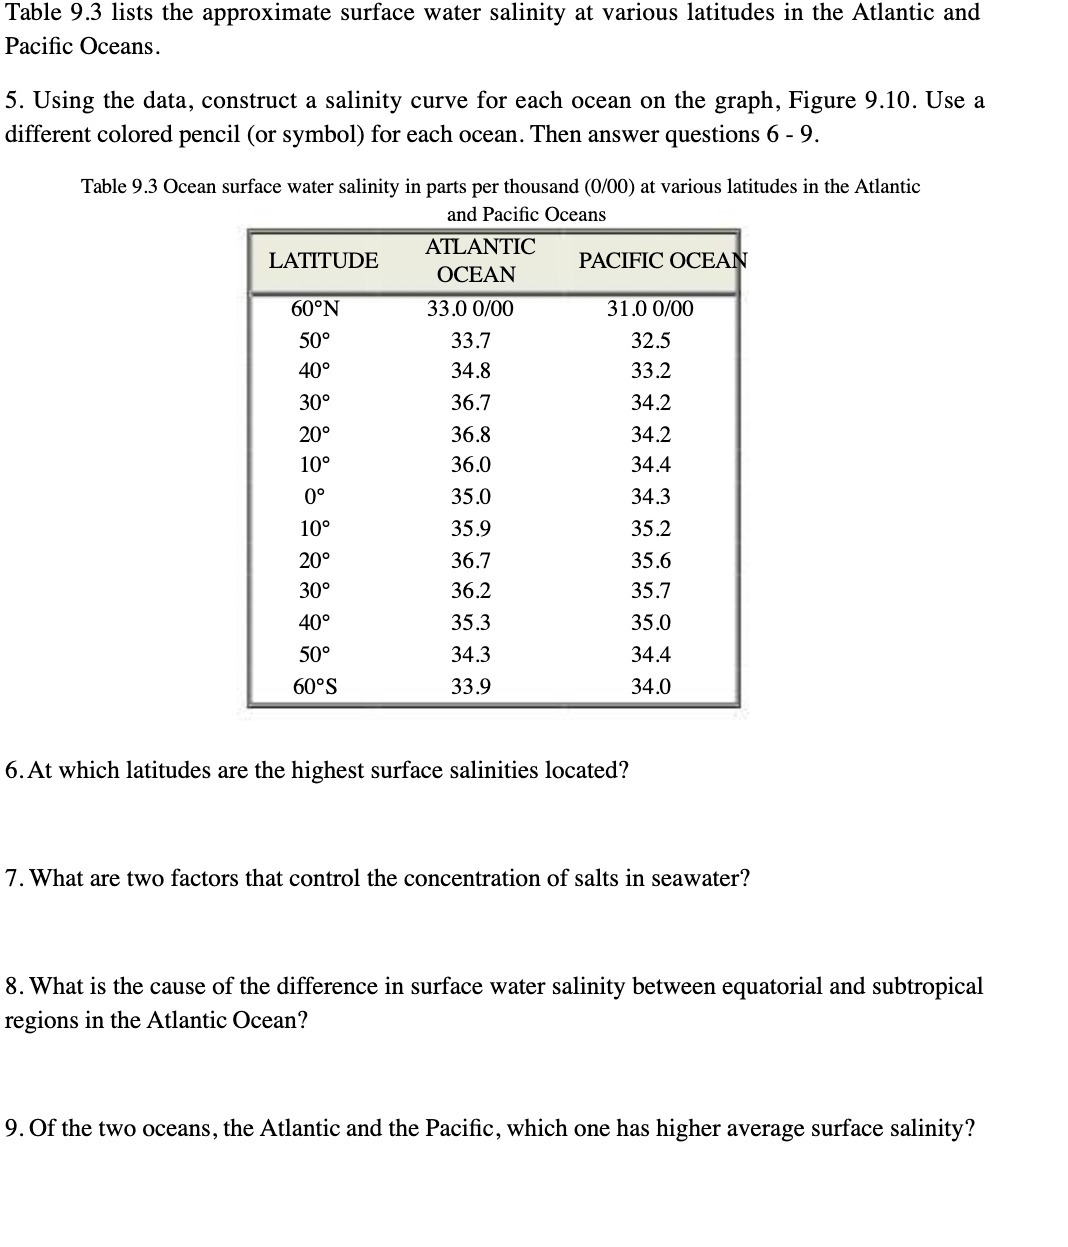
Question: Table 9.3 lists the approximate surface water salinity at various latitudes in the Atlantic and Pacic Oceans. 5. Using the data, construct a salinity curve

Table 9.3 lists the approximate surface water
Table 9.3 lists the approximate surface water salinity at various latitudes in the Atlantic and Pacic Oceans. 5. Using the data, construct a salinity curve for each ocean on the graph, Figure 9.10. Use a different colored pencil (or symbol) for each ocean. Then answer questions 6 - 9. Table 9.3 Ocean surface water salinity in parts per thousand (0f00) at various latitudes in the Atlantic and Pacic Oceans 60N 33.0 0100 31.0 0100 50 33.7 32.5 40 34.8 33.2 30 36.7 34.2 20 36.8 34.2 10 36.0 34.4 0 35.0 34.3 10 35.9 35.2 20 36.7 35.6 30 36.2 35.7 40 35.3 35.0 50 34.3 34.4 60S 33.9 34.0 6.At which latitudes are the highest surface salinities located? 7. What are two factors that control the concentration of salts in seawater? 8. What is the cause of the difference in surface water salinity between equatorial and subtropical regions in the Atlantic Ocean? 9. Of the two oceans, the Atlantic and the Pacic, which one has higher average surface salinity

Step by Step Solution

There are 3 Steps involved in it

1 Expert Approved Answer
Step: 1 Unlock blur-text-image
Question Has Been Solved by an Expert!

Get step-by-step solutions from verified subject matter experts

Step: 2 Unlock
Step: 3 Unlock

Students Have Also Explored These Related Mathematics Questions!