

Question: table [ [ A , B , C , D , E Month Jan-II February March April May June July August September October November
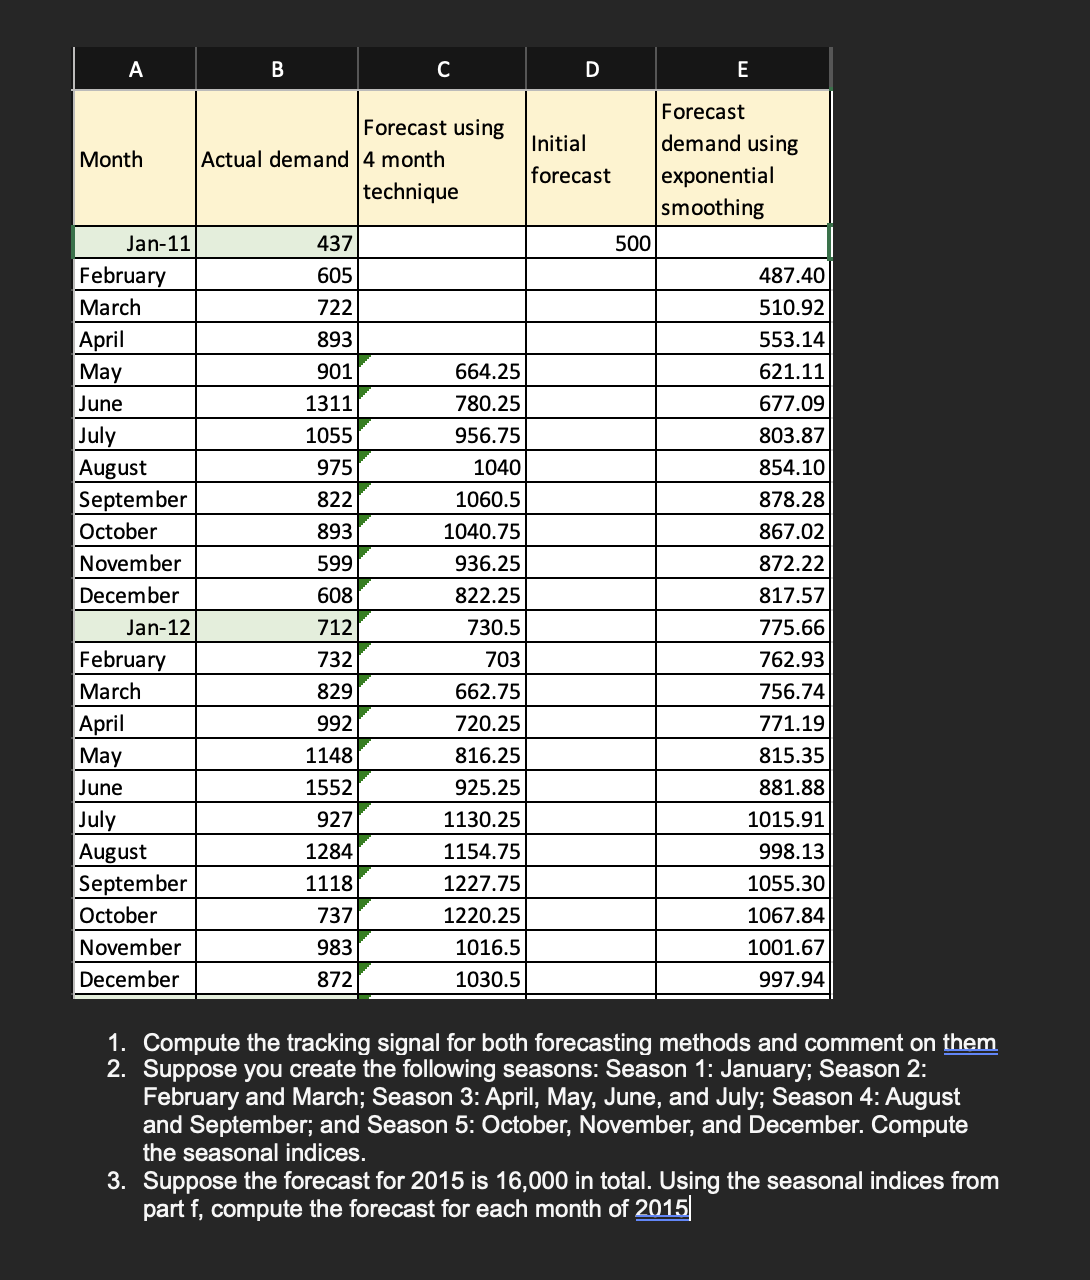
Month Jan-II February March April May June July August September October November December Jan-12 February March April May June July August September October November December Forecast using Actual demand 4 month technique Initial forecast 500 437 605 722 893 901 1311 1055 975 822 893 599 608 712 732 829 992 1148 1552 927 1284 1118 737 983 872 664.25 780.25 956.75 1040 1060.5 1040.75 936.25 822.25 730.5 703 662.75 720.25 816.25 925.25 1130.25 1154.75 1227.75 1220.25 1016.5 1030.5 Forecast demand using exponential smoothing 487.40 510.92 553.14 621.11 677.09 803.87 854.10 878.28 867.02 872.22 817.57 775.66 762.93 756.74 771.19 815.35 881.88 1015.91 998.13 1055.30 1067.84 1001.67 997.94 1. 2. 3. Compute the tracking signal for both forecasting methods and comment on them Suppose you create the following seasons: Season 1: January; Season 2: February and March; Season 3: April, May, June, and July; Season 4: August and September; and Season 5: October, November, and December. Compute the seasonal indices. Suppose the forecast for 2015 is 16,000 in total. Using the seasonal indices from part f, compute the forecast for each month of
Step by Step Solution
There are 3 Steps involved in it

Get step-by-step solutions from verified subject matter experts