

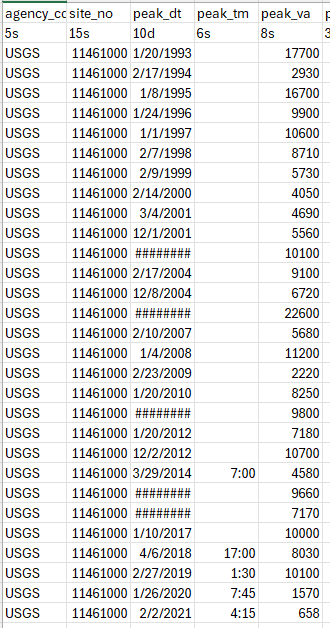
Question: table [ [ agency _ cc site _ no , peak _ dt , peak _ tm , peak _ va , ] ,
tableagencycc sitenopeakdtpeaktmpeakva s s s sUSGSUSGSUSGSUSGSUSGSUSGSUSGSUSGSUSGSUSGSUSGS######USGSUSGSUSGS#######USGSUSGSUSGSUSGSUSGS#######USGSUSGSUSGS:USGS########USGS#######USGSUSGS:USGS:USGS:USGS: Go to the USGS Water Data Website. Download annual peak discharge at the USGS Russian River Near Ukiah, California from October st to September th a Perform a Weibull Position Plot and determine the yr yr and yr flow rates. Don't put a comma or the units in the answer. Round to the one's digit. b Perform a Normal Distribution on the same data set. Determine the yr yr and yr flow rates. Don't put a comma or the units in the answer. Round to the one's digit. cPerform a Log Normal Distribution on the same data set. Determine the yr yr and yr flow rates. Don't put a comma or the units in the answer. Round to the one's digit.
Step by Step Solution
There are 3 Steps involved in it
1 Expert Approved Answer
Step: 1 Unlock

Question Has Been Solved by an Expert!
Get step-by-step solutions from verified subject matter experts
Step: 2 Unlock
Step: 3 Unlock