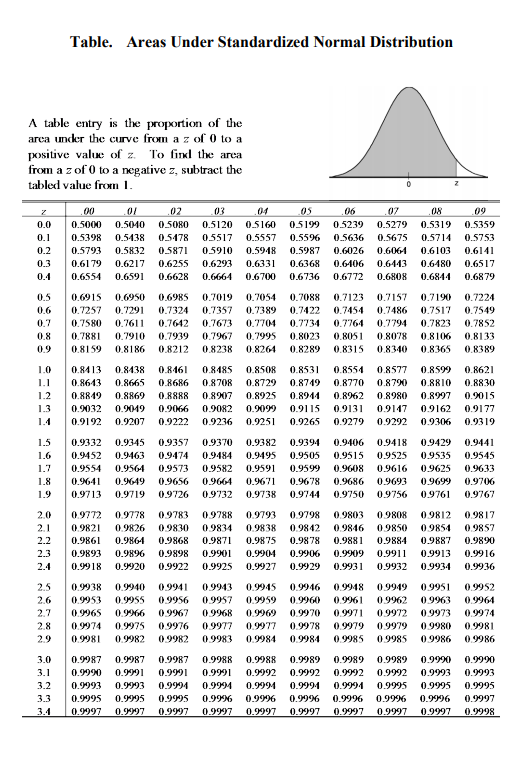
Question: Table. Areas Under Standardized Normal Distribution A table entry is the proportion of the arca under the curve from a z of 0 to a

Table. Areas Under Standardized NormalTable. Areas Under Standardized Normal

Table. Areas Under Standardized Normal Distribution A table entry is the proportion of the arca under the curve from a z of 0 to a positive value of z. To fix the area from a z of 0 to a negative z, subtract the tabled value from 1. Z 0.0 0.1 0.2 0.3 0.41 00 0.5000 0.5398 0.5793 0.6179 0.6554 01 0.5040 0.5438 0.5832 0.6217 0.6591 02 0_5080 0.5478 0.5871 0.6255 0.6628 03 0.5120 0.5517 05910 0.6293 0.6664 04 0.5160 0.5557 0.5948 0.6331 0.6700 05 05199 0.5596 0.5987 0.6368 0.6736 06 05239 0.5636 0.6026 0.6106 0.6772 07 0.5279 0.5675 0.6061 0.6143 0.6808 08 0.5319 0.5714 0.6103 0.6480 0.6844 09 0.5359 0.5753 0.6141 0.6517 0.6879 0.5 0.7 0.8 0.9 0.6915 0.7257 0.7580 0.7881 0.8159 0.6950 0.7291 0.7611 0.7910 0.8186 0.6985 0.7324 0.7642 0.7939 0.8212 0.7019 0.7357 0.7673 0.7967 0.8238 0.7054 0.7389 0.7704 0.7995 0.8261 0.7088 0.7422 0.7734 0.8023 0.8289 0.7123 0.7454 0.7764 0.8051 0.8315 0.7157 0.7486 0.7794 0.8078 0.8340 0.7190 0.7517 0.7823 0.8106 0.8365 0.7224 0.7549 0.7852 0.8133 0.8389 1.0 1.1 1.2 1.3 1.1 0.8413 0.8643 0.8849 0.9032 0.9192 0.8438 0.8665 0.8869 0.9049 0.9207 0.8461 0.8686 0.8888 0.9066 0.9222 0.8485 0.8708 0.827 0.9082 0.9236 0.8508 0.8729 0.8925 0.9099 0.9251 0.8531 0.8749 0.8941 0.91 IS 0.9265 0.8554 0.8770 0.8962 0.9131 0.9279 0.8577 0.8720 0.8980 0.9147 0.9292 0.8.599 0.8810 0.8997 0.9162 0.9306 0.8621 0.88.30 0.2015 0.9177 0.9319 1.5 1.6 1.7 1.8 1.9 0.9332 0.9452 0.9554 0.1641 0.9713 0.9345 0.9463 0.9564 0.149 0.9719 0.9357 0.9474 0.9573 0.9656 0.9726 0.9370 0.9484 0.9582 0.9664 09732 0.9382 0.9495 0.9591 0.9671 0.9738 0.9394 0.9505 0.9599 0.9678 0.9744 0.9406 0.9515 0.9608 0.9686 0.9750 0.9418 0.9525 0.9616 0.9693 0.9756 0.9429 0.9535 0.9625 0.9699 0.9761 0.9441 0.9545 0.9633 0.9706 0.9767 2.0 2.1 2.2 2.3 2.4 0.9772 0.9821 0.9861 0.9893 0.9918 0.9778 0.9826 0.9864 0.9896 0.9920 09783 09830 0.9868 0.9898 0.9922 09788 09834 0.9871 0.9901 0.9925 09793 0.9838 0.9875 0.9904 0.9927 0.9798 0.9842 0.9878 0.9906 0.9929 09803 0.9846 0.9881 0.929 0.9931 09808 09850 0.9884 0.9911 0.9932 0.9817 0.9857 0.9890 0.9916 0.9936 09812 09854 0.9887 0.9913 0.9934 0 9951 09963 09973 09980 09986 2.5 2.6 27 2.8 2.9 0.9938 0.9953 0.9965 0.9974 0.9981 0.9940 0.9955 0.9766 0.9975 0.9982 09941 09956 0.9867 09976 0.9982 0.9943 09957 09968 09977 09983 0.9945 0.9959 0.9969 0.9977 0.9984 0.9946 0.9960 0.9970 0.9978 0.9984 0.9948 0.9961 09971 09979 0.9985 09949 0 9962 09972 09979 09985 0.9952 0.9964 0.9974 0.9981 0.9986 3.0 3.1 3.2 3.3 3.1 0.1987 0.90N) 0.1993 0.995 0.1997 0.9987 0.991 0.9093 0.995 0.997 0.9987 0.991 0.991 0.9995 0.997 0.9988 0.9901 0.9944 0.99% 0.9997 0.9088 0.992 0.999 0.9996 0.9997 0.9989 0.9992 0.9991 0.99% 0.9997 0.9989 0.9992 0.9994 0.9996 0.9997 0.9989 0.9992 0.9995 0.9986 0.9997 0.9990 0.9993 0.9995 0.9996 0.9997 0.9990 0.9993 0.9995 0.9997 0.9998 H. (14 marks) A company wants to plan its production schedule based on a forecast of how many production units will be demanded in the beginning of next year. The company has collected the sales data for the 12 months in last year, shown as below: Month January February March April May June July August September October November December Production Sales (Units) 105 120 135 160 180 200 210 170 150 120 110 100 Based on the table above, a. Compute a three-month moving average forecast for last April through January in next year, and compute the forecast error for each month; b. Compute a five-month moving average forecast for last June through January in next year, and compute the forecast error for each month; c. Compute a weighted three-month moving average forecast (using weights of 0.2, 0.3, and 0.5 for the most recent, next recent, and most distant data, respectively) for last April through January in next year, and compute the forecast error for each month; d. Compare the forecasts computed in parts (a), (b), and (c) based on their cumulative error and find the most accurate one. Do the forecasts show any trends for the production sales

Step by Step Solution

There are 3 Steps involved in it

1 Expert Approved Answer
Step: 1 Unlock blur-text-image
Question Has Been Solved by an Expert!

Get step-by-step solutions from verified subject matter experts

Step: 2 Unlock
Step: 3 Unlock

Students Have Also Explored These Related General Management Questions!