

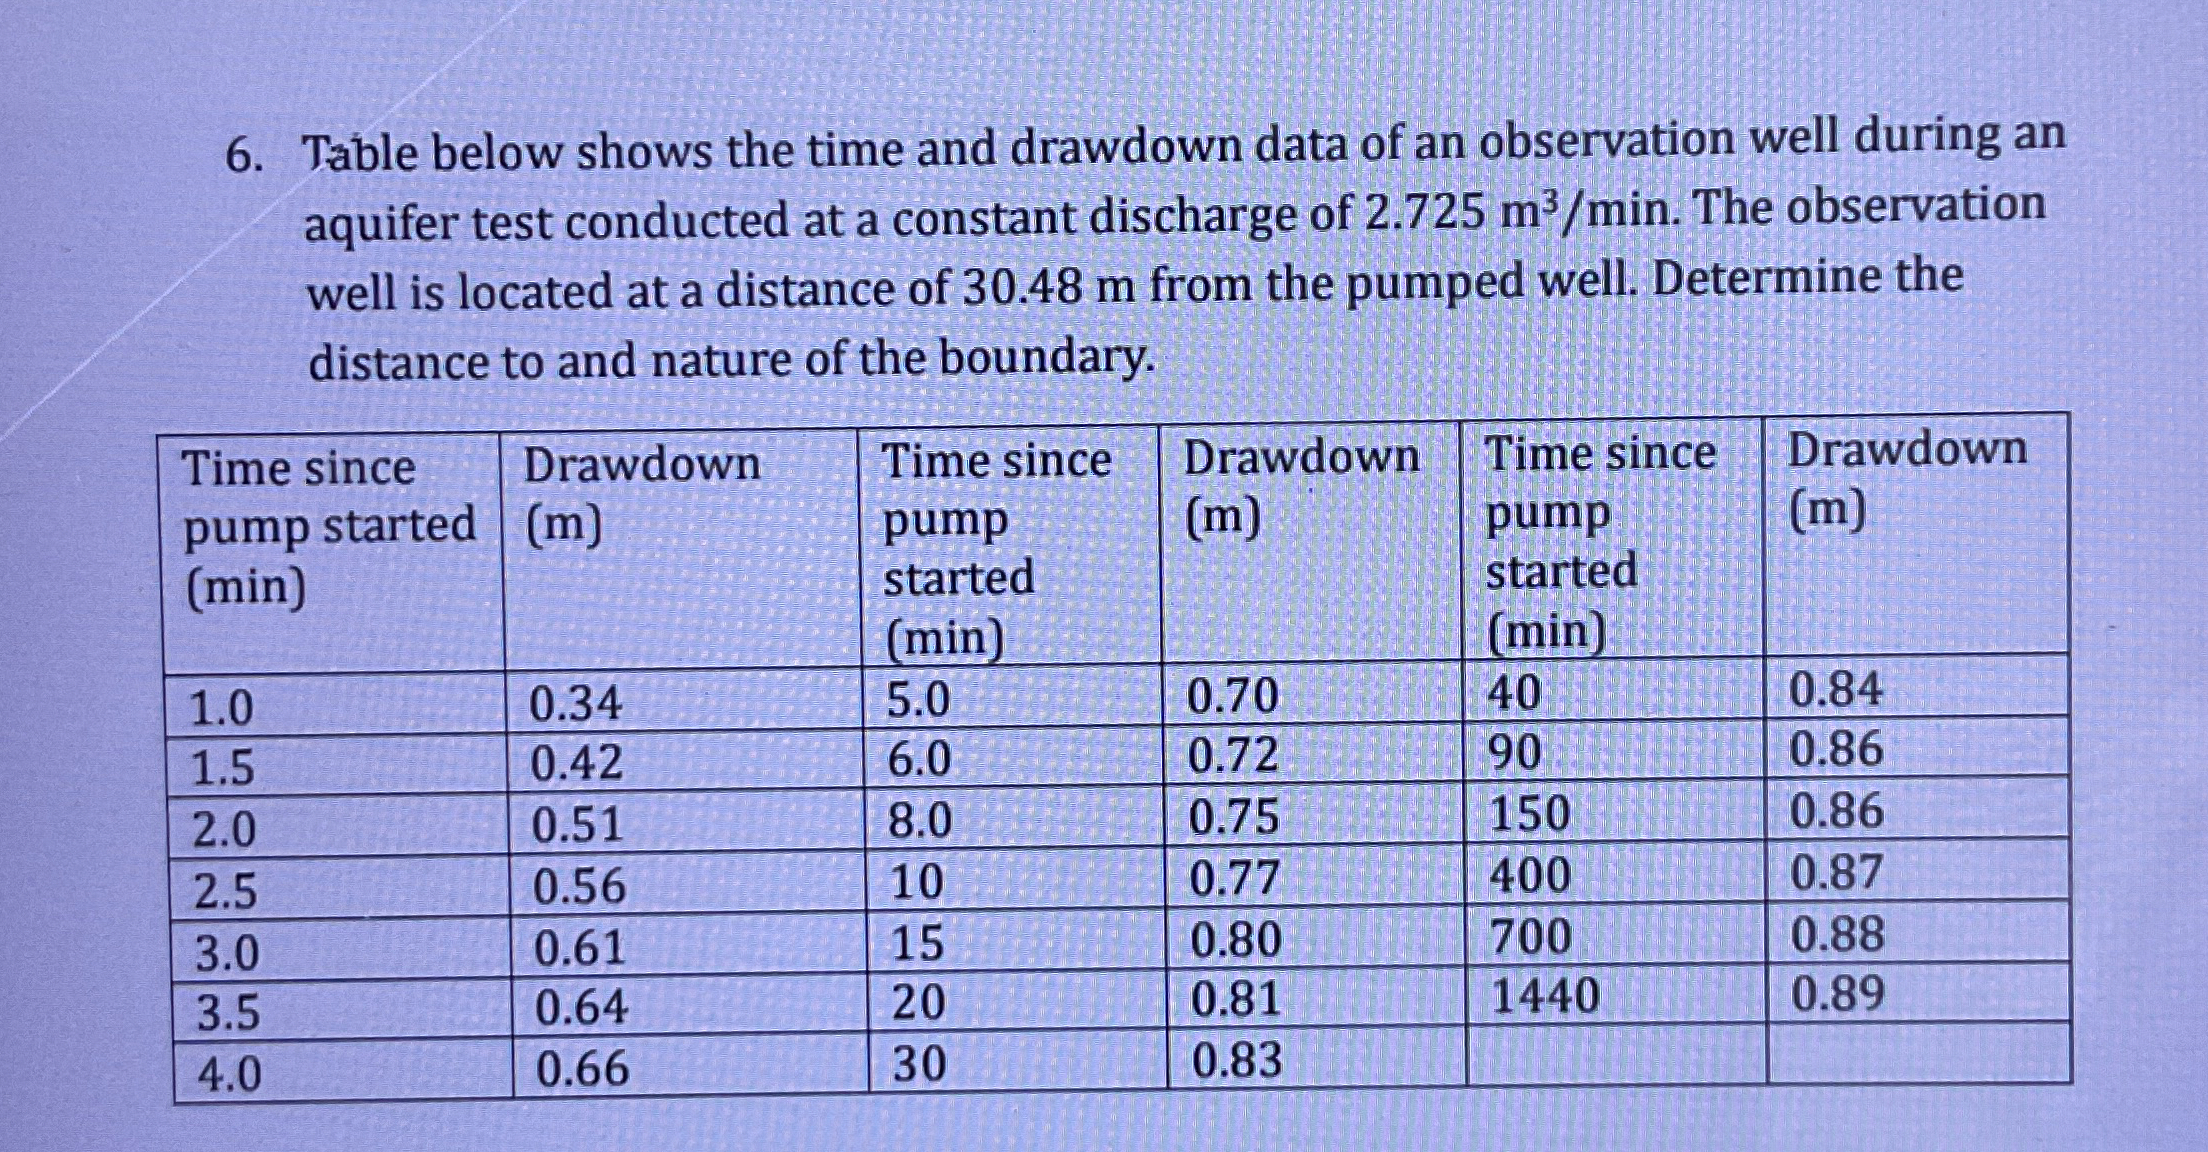
Question: Table below shows the time and drawdown data of an observation well during an aquifer test conducted at a constant discharge of 2 . 7
Table below shows the time and drawdown data of an observation well during an aquifer test conducted at a constant discharge of The observation well is located at a distance of from the pumped well. Determine the distance to and nature of the boundary.
tabletableTime sincepump startedmintableDrawdown
Step by Step Solution
There are 3 Steps involved in it
1 Expert Approved Answer
Step: 1 Unlock

Question Has Been Solved by an Expert!
Get step-by-step solutions from verified subject matter experts
Step: 2 Unlock
Step: 3 Unlock