

Question: table, E. estimate the: y for each stock. ocks. o cookie i Data Table . X (Click on the following icon W order to copy
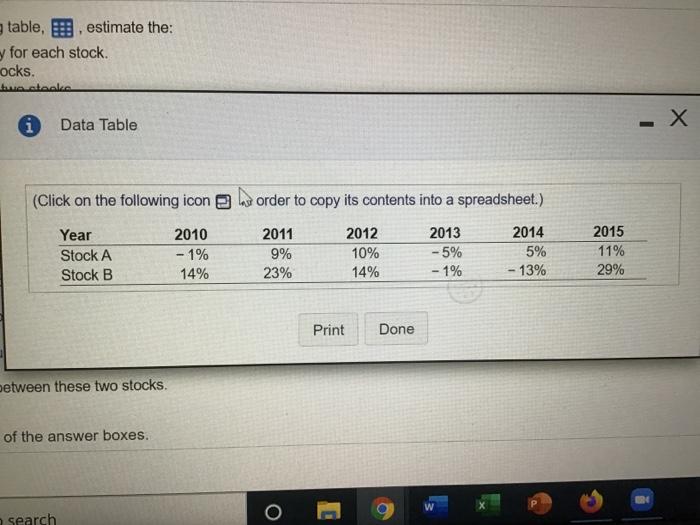
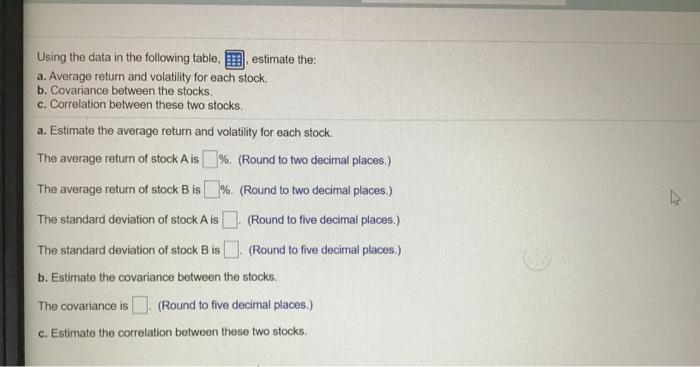
table, E. estimate the: y for each stock. ocks. o cookie i Data Table . X (Click on the following icon W order to copy its contents into a spreadsheet.) Year Stock A Stock B 2010 - 1% 14% 2011 9% 23% 2012 10% 14% 2013 - 5% - 1% 2014 5% - 13% 2015 11% 29% Print Done between these two stocks. of the answer boxes. W o search Using the data in the following table, estimate the: a. Average return and volatility for each stock. b. Covariance between the stocks, c. Correlation between these two stocks. a. Estimate the average return and volatility for each stock, The average return of stock Ais %. (Round to two decimal places.) The average return of stock B is % (Round to two decimal places.) The standard deviation of stock Ais . (Round to five decimal places.) The standard deviation of stock Bis. (Round to five decimal places.) b. Estimate the covariance between the stocks. The covariance is (Round to five decimal places.) c. Estimate the correlation between these two stocks, 4
Step by Step Solution
There are 3 Steps involved in it

Get step-by-step solutions from verified subject matter experts