

Question: Table i. Experim en tot Free Fall Data Time (s) _ Position, x (cm) _ Velocity, v (cmls} 0016666667 _ 1.9 120 0.033333333 4 135
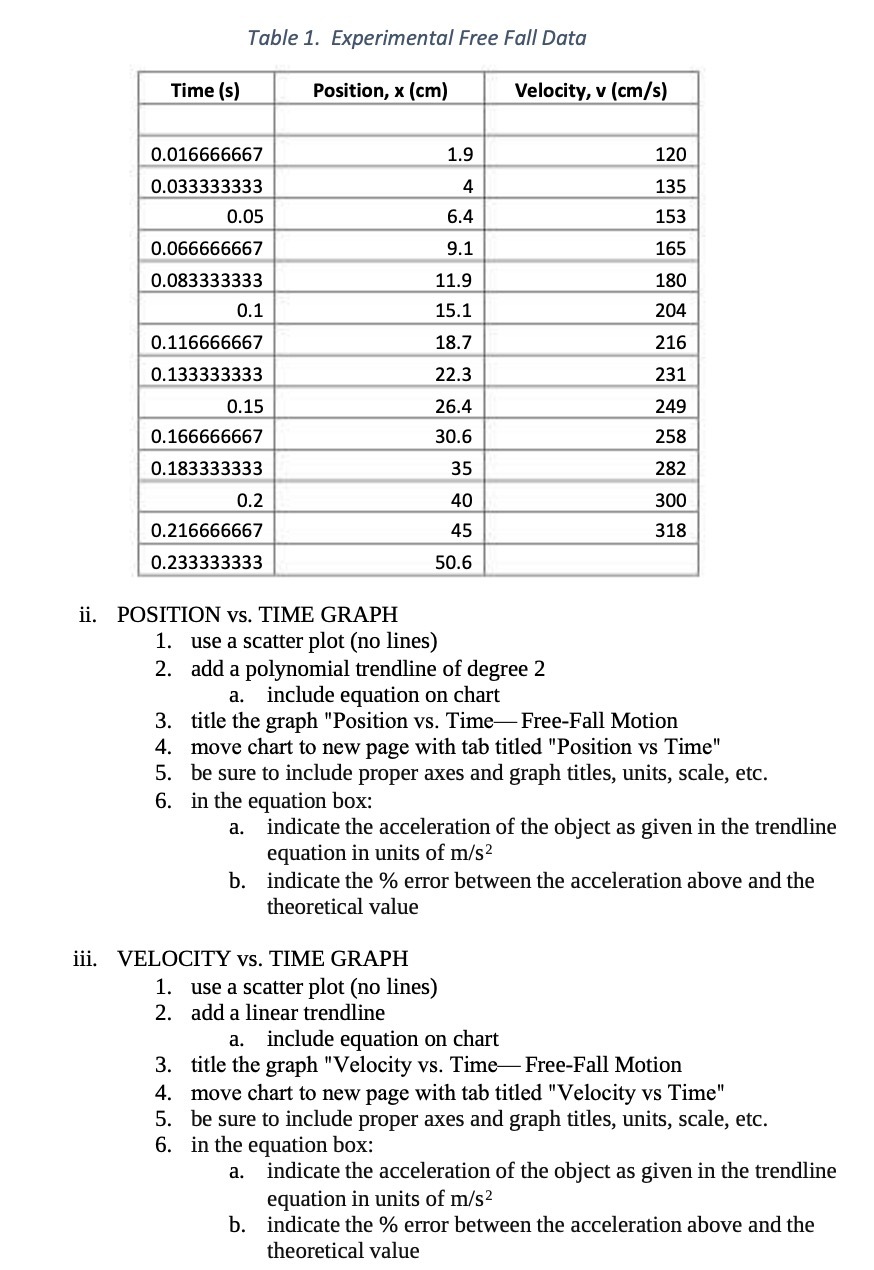
Table i. Experim en tot Free Fall Data Time (s) _ Position, x (cm) _ Velocity, v (cmls} 0016666667 _ 1.9 120 0.033333333 4 135 0.05 6.4 153_ 0 066666667 9. 1 165 0.083333333 11.8 _ 180_ 0.1 15.1 . 204_ 0.116666667 _ 18.7 216 0133333333 . 22.3 231 0.15 26.4 24E]I 0 166666667 30.6 258 0.183333333 35 282 0.2 40 300 ' 0216666667 45 318 1 0.233333333 50.6 ii. POSITION vs. TIME GRAPH 1. use a scatter plot (no lines) 2. add a polynomial trendline of degree 2 a. include equation on chart title the graph "Position vs. Time Free-Fall Motion move chart to new page with tab titled "Position vs Time" be sure to include proper axes and graph titles, units, scale, etc. in the equation box: a. indicate the acceleration of the object as given in the trendline equation in units of W52 b. indicate the % error between the acceleration above and the theoretical value 53291.43?\" iii. VELOCITY vs. TIME GRAPH 1. use a scatter plot (no lines) 2. add a linear trendline a. include equation on chart title the graph "ir'eloeityr vs. Time Free-Fall Motion move chart to new page with tab titled "Velocity vs Time" be sure to include proper axes and graph titles, units, scale, etc. in the equation box: a. indicate the acceleration of the object as given in the trendline equation in units of W52 b. indicate the % error between the acceleration above and the theoretical value 53291.43?\
Step by Step Solution
There are 3 Steps involved in it

Get step-by-step solutions from verified subject matter experts