

Question: Table of critical values Sample Size, n 5 6 7 8 9 Critical Value 0.880 0.888 0.898 0.906 0.912 0.918 0.923 0.928 0.932 0.935 0.939
Table of critical values Sample Size, n 5 6 7 8 9 Critical Value 0.880 0.888 0.898 0.906 0.912 0.918 0.923 0.928 0.932 0.935 0.939 Sample Size, n 16 17 18 19 20 21 22 23 24 25 30 Critical Value 0.941 0.944 0.946 0.949 0.951 0.952 0.954 0.956 0.957 0.959 0.960 10 11 12 13 14 15
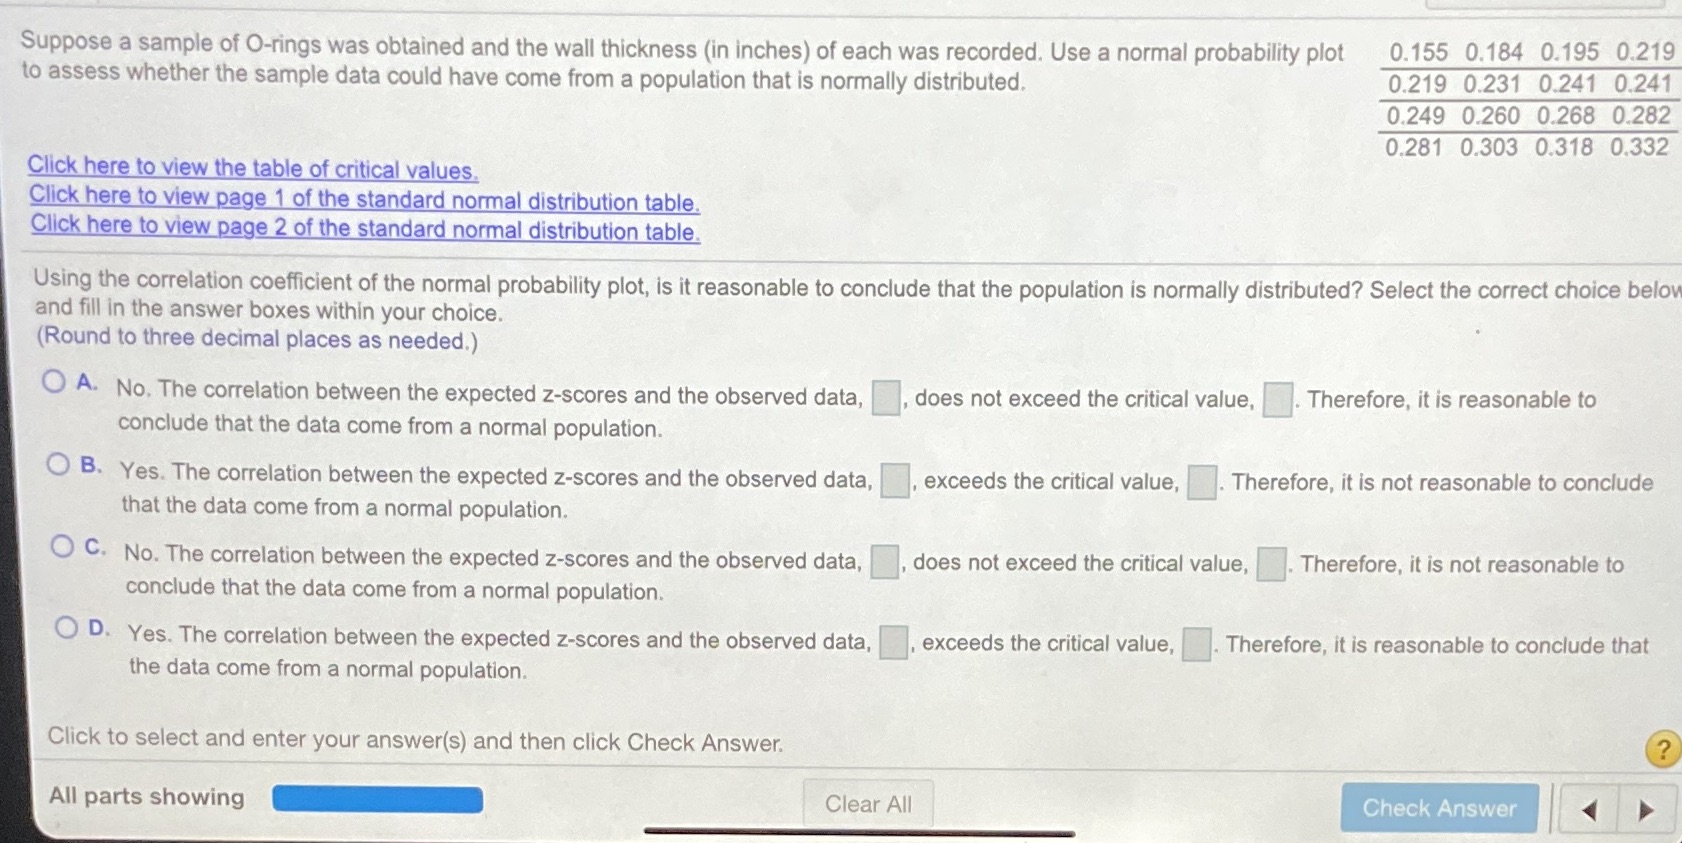
Suppose a sample of O-rings was obtained and the wall thickness (in inches) of each was recorded. Use a normal probability plot 0.155 0.184 0.195 0.219 to assess whether the sample data could have come from a population that is normally distributed. 0.219 0.231 0.241 0.241 0.249 0.260 0.268 0.282 0.281 0.303 0.318 0.332 Click here to view the table of critical values. Click here to view page 1 of the standard normal distribution table. Click here to view page 2 of the standard normal distribution table. Using the correlation coefficient of the normal probability plot, is it reasonable to conclude that the population is normally distributed? Select the correct choice below and fill in the answer boxes within your choice. (Round to three decimal places as needed.) O A. No. The correlation between the expected z-scores and the observed data, does not exceed the critical value, Therefore, it is reasonable to conclude that the data come from a normal population. B. Yes. The correlation between the expected z-scores and the observed data, exceeds the critical value, Therefore, it is not reasonable to conclude that the data come from a normal population. O C. No. The correlation between the expected z-scores and the observed data, does not exceed the critical value, . Therefore, it is not reasonable to conclude that the data come from a normal population. O D. Yes. The correlation between the expected z-scores and the observed data, exceeds the critical value, Therefore, it is reasonable to conclude that the data come from a normal population. Click to select and enter your answer(s) and then click Check Answer. ? All parts showing Clear All Check
Step by Step Solution
There are 3 Steps involved in it

Get step-by-step solutions from verified subject matter experts