

Question: Draw a normal probability plot of the data in Table 4 using technology. Is there evidence to support the belief that the variable finishing time
Draw a normal probability plot of the data in Table 4 using technology. Is there evidence to support the belief that the variable “finishing time” is normally distributed?
Approach We will use StatCrunch to draw the normal probability plot and find the correlation between the observed values and expected z-scores. If the correlation is greater than the critical value from Table VI, we conclude the data could come from a population that is normally distributed. The steps for constructing normal probability plots using TI-83/84 Plus graphing calculators, Minitab, Excel, and StatCrunch can be found.
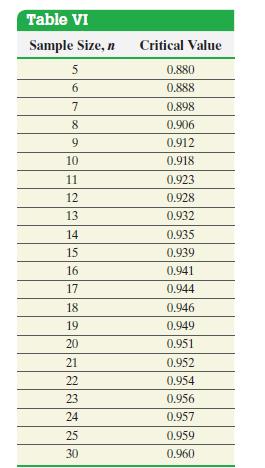
Table VI Sample Size, n Critical Value 5 0.880 6 0.888 7 0.898 8 0.906 9 0.912 10 0.918 11 0.923 12 0.928 13 0.932 14 0.935 15 0.939 16 0.941 17 0.944 18 0.946 19 0.949 20 0.951 21 0.952 22 0.954 23 0.956 24 0.957 25 0.959 30 0.960
Step by Step Solution
3.39 Rating (152 Votes )
There are 3 Steps involved in it
Figure 34 shows the normal probability plot The correlation between the observ... View full answer

Get step-by-step solutions from verified subject matter experts